The Embedded Analytics Stack Decision Tree

Every SaaS product reaches the same moment.
Users ask for dashboards. Product teams want insights inside the app. Engineers look for a safe solution.
Most teams respond by adding tools. This guide starts from a different place.
Customer analytics does not begin with tools. It begins with a product question: what does the product need right now?
The embedded analytics stack decision tree helps product teams answer that question. It shows how to match analytics choices to product stage, data setup, and team structure. All without building more than needed.
Across every path in the tree, Luzmo plays the same role. It acts as the embedded analytics layer between your data and your users, so teams can ship customer dashboards early and grow them as the product evolves.
You don’t need a “full” modern data stack
Once teams decide they need analytics, they often look outward for answers.
They read blog posts about modern data stacks. They see long diagrams filled with tools. Soon, a warehouse, ETL jobs, and a BI tool appear in the roadmap.
This often happens before customers see a single dashboard.
At this stage, teams spend more time connecting systems than shipping product features. Engineers maintain pipelines. Product teams wait for small changes. Analytics becomes heavy and hard to move.
This pattern is common, but it is not required.
For most SaaS products, early customer analytics has a simple goal: answer basic questions inside the product. Users want to see usage, trends, or totals that relate to their own account.
A large stack does not help with that goal. It adds cost, setup work, and long feedback loops.
What teams actually need at the start is much smaller:
- One data source that stays fast
- A front-end analytics layer inside the product
- User-level and tenant-level access rules
This is where embedded analytics fits.
Start with your reality: three SaaS archetypes
Before choosing tools, it helps to be honest about where your product is today.
Many teams copy stacks from larger companies. Those stacks solved problems at a different stage. This often leads to extra work with little user impact.
Most SaaS products fall into one of the three archetypes below. You may not match one perfectly, but one usually feels closest.
Archetype A: early-stage SaaS
This is the most common starting point.
The product runs on a transactional database. There is no data team. Engineers handle reporting when needed.
Customers begin asking questions like:
- “How many items did I process this week?”
- “Can I see usage per user?”
- “Can I export this as a report?”
The usual response is manual work. Someone runs a query. Results go into a spreadsheet. Over time, this breaks down.
The risk here is jumping too fast into a large stack. A warehouse and BI tool sound safe, but they slow shipping.
For this archetype, the goal is simple: ship basic dashboards inside the product with minimal setup.
💡 Early-stage teams usually delay customer analytics because it feels like a big project. Luzmo lets these teams start with one database and ship dashboards directly inside the app, without hiring a data team or adding a BI tool.
Archetype B: growth-stage SaaS
At this stage, the company already invested in data tools.
There is often:
- A cloud warehouse such as ClickHouse, Snowflake, or BigQuery
- dbt models or similar transformations
- Internal dashboards for teams
Customer-facing analytics, however, is still missing or limited.
Product teams face new problems:
- Dashboards take weeks to change
- Metrics differ between internal and customer views
- Building a custom analytics UI takes too much engineering time
Here, the stack already exists. The challenge is the front end.
This archetype benefits from reusing the warehouse and placing an embedded analytics layer on top, instead of building one from scratch.
💡 Growth-stage teams already trust their data models. The real gap is customer access. Luzmo sits on top of the warehouse and turns internal metrics into customer-facing dashboards without copying logic or rebuilding UI.
Archetype C: data-heavy or AI-curious SaaS
Some products depend deeply on data.
They handle:
- Large volumes of events
- Strict performance needs
- Advanced users who ask complex questions
These teams also look toward AI features. They want text-based questions, smart summaries, or guided insights inside the product.
The risk here is adding separate systems for dashboards, AI chat, and metrics logic.
For this archetype, the focus is one shared analytics layer. Dashboards and AI features work on the same datasets and rules.
Each archetype leads to a different stack choice, but the starting point is the same: understand your current product reality first.
💡 Data-heavy products often split dashboards, metrics logic, and AI features across different systems. Luzmo keeps these parts together. Dashboards and AI features work on the same datasets, rules, and permissions.
The decision tree: how far should you go?
This section turns the problem into a set of clear questions.
Each question pushes you toward a stack that fits your product today. The goal is not to reach the most complex setup. The goal is to stop at the first setup that works.
Who is analytics for?
This is the first and most important question. If analytics is only for internal teams, many tools can work. Speed, access rules, and UI polish matter less. If analytics is for paying customers, the rules change.
Customer-facing analytics needs:
- Login-based access
- Tenant separation
- Dashboards inside the product UI
At this point, embedded analytics becomes the right direction. Luzmo sits inside the product and acts as the front-end analytics layer.
💡 Internal BI tools stop working the moment analytics becomes part of the product. Luzmo is built for customer-facing use from day one, with tenant isolation and embedding as first-class concepts.
Do you have a data team?
The size and focus of your team shapes the stack. If you do not have a data team, heavy tooling creates risk. Every change needs engineering time.
A smaller setup works better:
- App database or one analytics database
- Embedded dashboards built with Luzmo Studio
If you do have a data team, you already invested in models and metrics.
In that case:
- Keep the warehouse
- Keep existing transformations
- Connect Luzmo on top of that work
This keeps ownership clear and avoids rewriting logic.
💡 Luzmo adapts to team structure. Teams without a data team use visual dataset and dashboard tools. Teams with a data team connect Luzmo to existing models and keep ownership where it belongs.
Do you already run a warehouse?
Some teams think a warehouse is a hard requirement. It is not. If you already run one, use it. Luzmo connects directly to ClickHouse and other warehouses.
If you do not, starting with one fast analytics database is often enough.
Many customer dashboards run well on a single source when queries stay focused and scoped per tenant.
This keeps the stack smaller and easier to maintain.
How much UI control do you need?
Not every product needs full control on day one. If time-to-market matters most:
- Use Luzmo Studio
- Embed ready dashboards
- Let product or business users edit views
If the product has strict UX rules or brand limits:
- Use the Luzmo Flex SDK
- Build custom components
- Control layout and interactions in code
Both paths share the same analytics core. Teams can start simple and move later.
💡 Most products do not need full UI control at the start. Luzmo supports both paths: start with ready dashboards, then move to fully custom views later, without changing the analytics core.
Do you want AI-style analytics?
Some teams want text-based questions or guided insights from the start. If that is the case, dashboards alone are not enough.
Instead of adding a separate chat or AI tool, use the same analytics layer:
- Luzmo IQ for natural language queries
- Agent APIs for guided analysis and visuals
If AI is not needed yet, dashboards are a good first step. AI features can come later without a stack change.
By answering these questions in order, most teams find a clear stopping point. That stopping point defines the right stack archetype.
💡 AI analytics fails when it works on unclear or duplicated metrics. Luzmo IQ builds on the same datasets and rules as dashboards, so text-based questions and charts stay aligned.
Stack archetypes
This section turns the decision tree into concrete stack patterns. Each stack below is "good enough" for a clear product stage. None of them tries to solve future problems too early.
The common idea is simple: Luzmo sits between your data and your users.
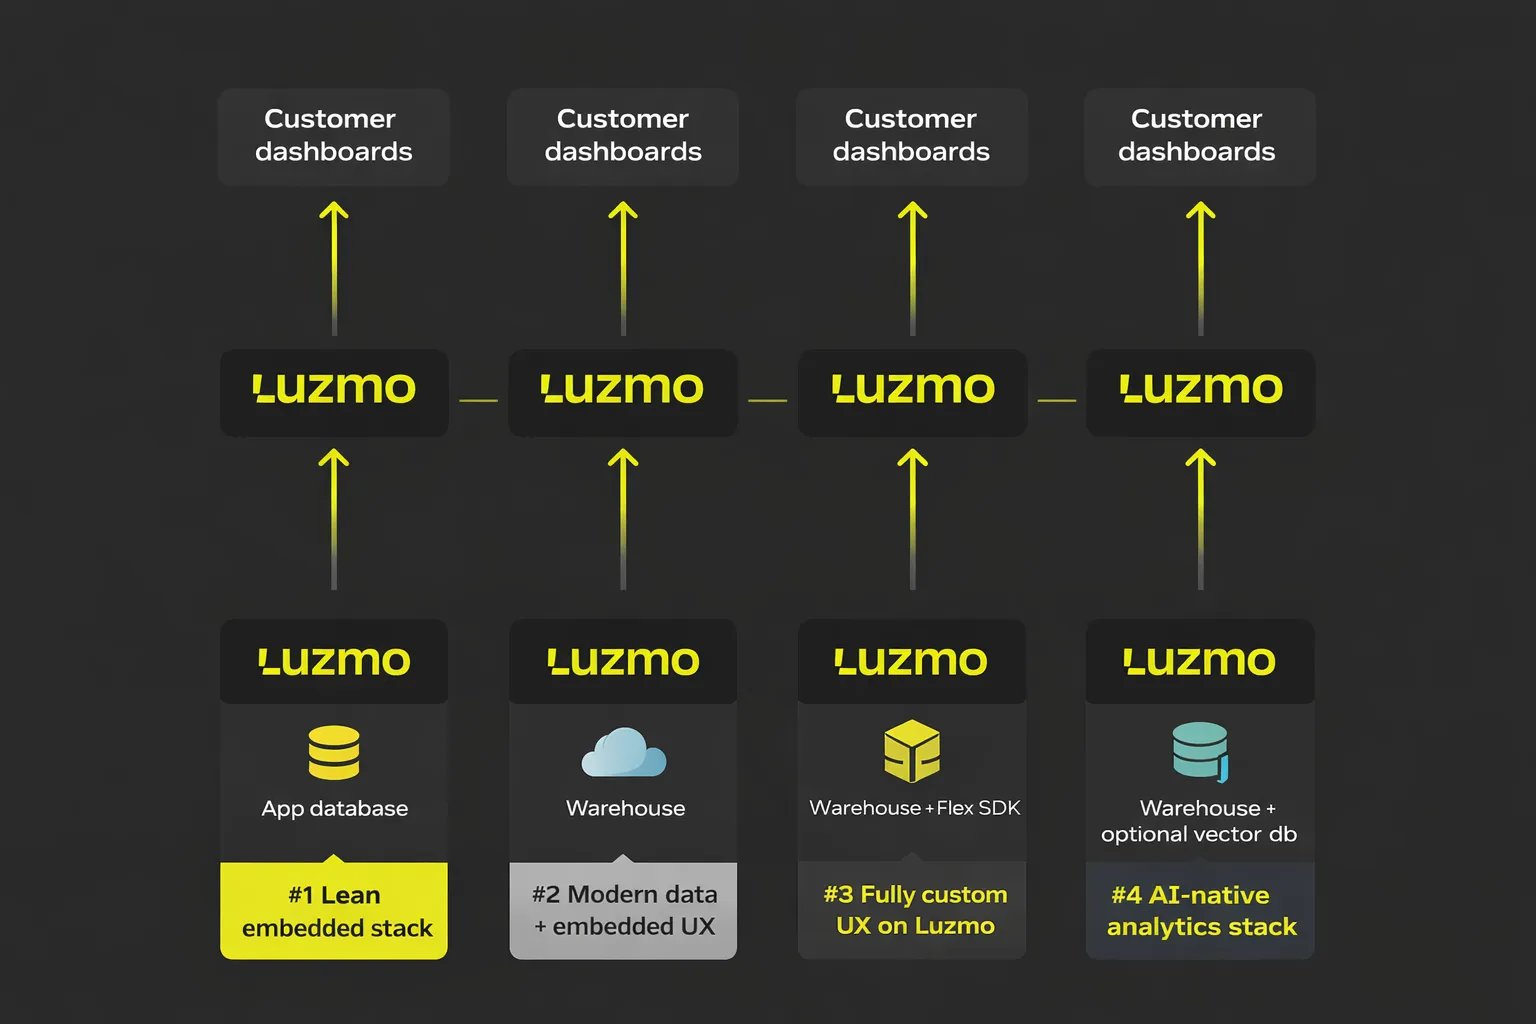
#1 Lean embedded stack
When to use: early-stage SaaS without a data team
This is the fastest path to customer dashboards. The product already has data in the app database. Queries stay simple and scoped per tenant.
Data layer
- App database or single analytics database
- Common choices: Postgres or ClickHouse
Analytics / UX layer
- Luzmo Studio
- Embedded dashboards inside the product
What this looks like in practice
A product manager defines charts in Luzmo Studio. Engineers embed them behind login. Customers see usage and trends without leaving the app.
Why teams stop here
- No separate BI tool
- No chart code in the product
- Dashboards change without deployments
#2 Modern data + embedded UX
When to use: growth-stage SaaS with a warehouse
The data stack already exists. Internal teams trust the metrics. The missing part is customer access.
Data layer
- Cloud warehouse or ClickHouse
- Existing models and transformations stay as they are
Analytics / UX layer
- Luzmo embedded dashboards
- Tenant isolation and white-labeling
What this looks like in practice
The same metric powers internal reports and customer views. Product teams choose which views go to users. Changes happen without copying logic.
Why teams stop here
- No custom analytics front end
- One source of truth for metrics
- Faster iteration on customer feedback
#3 Fully custom UX on Luzmo
When to use: products with strict brand or interaction rules
Some products need charts to look and behave like native UI elements.
Data layer
- Same warehouse or analytics database as above
Analytics / UX layer
- Luzmo Flex SDK
- Custom-built components
What this looks like in practice
Engineers build views that match the product style. Luzmo handles queries, filters, and permissions behind the scenes.
Why teams stop here
- Full control over layout
- No need to build analytics logic from zero
- Shared core with other stacks
#4 AI-native analytics stack
When to use: SaaS teams adding AI copilots or smart insights
This stack fits products where users ask questions, not just read charts.
Data layer
- Warehouse or analytics database
- Optional vector store
Analytics / UX layer
- Luzmo IQ
- Agent APIs inside the product UI
What this looks like in practice
Users type questions. The system returns charts, summaries, or trends based on trusted metrics.
Why teams stop here
- Dashboards and AI share the same data rules
- No parallel analytics systems
- One place to manage metrics and access
Luzmo’s role in avoiding overbuild
Across all stacks in this article, one pattern stays the same.
Teams do not fail because of missing tools. They fail because they build too much too early.
Luzmo sits in the stack to remove that pressure.
Instead of building an analytics front end inside the product, teams use Luzmo as a shared layer for charts, datasets, and access rules.
This changes how teams work.
Product teams focus on questions users ask. Engineers focus on core product logic. Data teams, if they exist, keep ownership of metrics.
Luzmo covers the parts that usually slow teams down:
- Dashboard creation
- Dataset logic
- Tenant-level access rules
- Embedding and authentication
Because these parts already exist, teams move faster without locking themselves into a heavy stack.
Another key point is growth.
Many products start with simple dashboards. Later, they add more views, stricter access rules, or AI-style features.
With Luzmo, this happens on the same core:
- Dashboards come first
- Custom UX comes later
- AI features sit on top of the same data
There is no need to replace tools or rewrite analytics logic when the product matures.
Final thoughts
Customer analytics should move at the same pace as your product.
That rarely happens with a stack built from many disconnected tools. It happens when analytics lives inside the product and grows step by step with real user needs.
The decision tree in this article shows that most SaaS teams do not need more infrastructure. They need the right analytics layer at the right moment.
Luzmo is built for that role. It helps product teams ship customer dashboards early, keep control as requirements change, and grow toward custom UX or AI features without starting over.
If your product is reaching the point where analytics becomes part of the experience, this is the right time to look at Luzmo.
Start with the stack you need today. Sign up for a free trial and let Luzmo carry the rest as your product grows.
FAQ
Do I need a data warehouse before adding customer analytics?
No. Many SaaS products start with an app database or a single analytics database. For early customer dashboards, this setup is often enough. Luzmo works with both simple databases and full warehouses, so teams can start small and grow later.
How is embedded analytics different from a BI tool?
A BI tool is built for internal teams. Embedded analytics lives inside the product and serves paying customers. Luzmo is built for this use case, with tenant separation, embedding, and product-ready dashboards from the start.
When should I move from dashboards to a custom analytics UI?
Most products begin with ready dashboards and move to custom views only when brand or interaction needs become stricter. With Luzmo, teams can start in Studio and later use the Flex SDK on the same analytics core, without rebuilding everything.
Can AI analytics and dashboards use the same data?
Yes. Dashboards and AI features work best when they share the same datasets and rules. Luzmo IQ and Agent APIs sit on top of the same analytics layer as dashboards, so answers, charts, and summaries stay aligned.
Written by

Ship the future of your data
Let us show you what Luzmo can do for your product.

Leave your e-mail and one of our analytics experts will reach out to you