 ChatGPT
 Perplexity
.png)
.png)
.png)
Build your first embedded data product now. Talk to our product experts for a guided demo or get your hands dirty with a free 10-day trial.

.png)
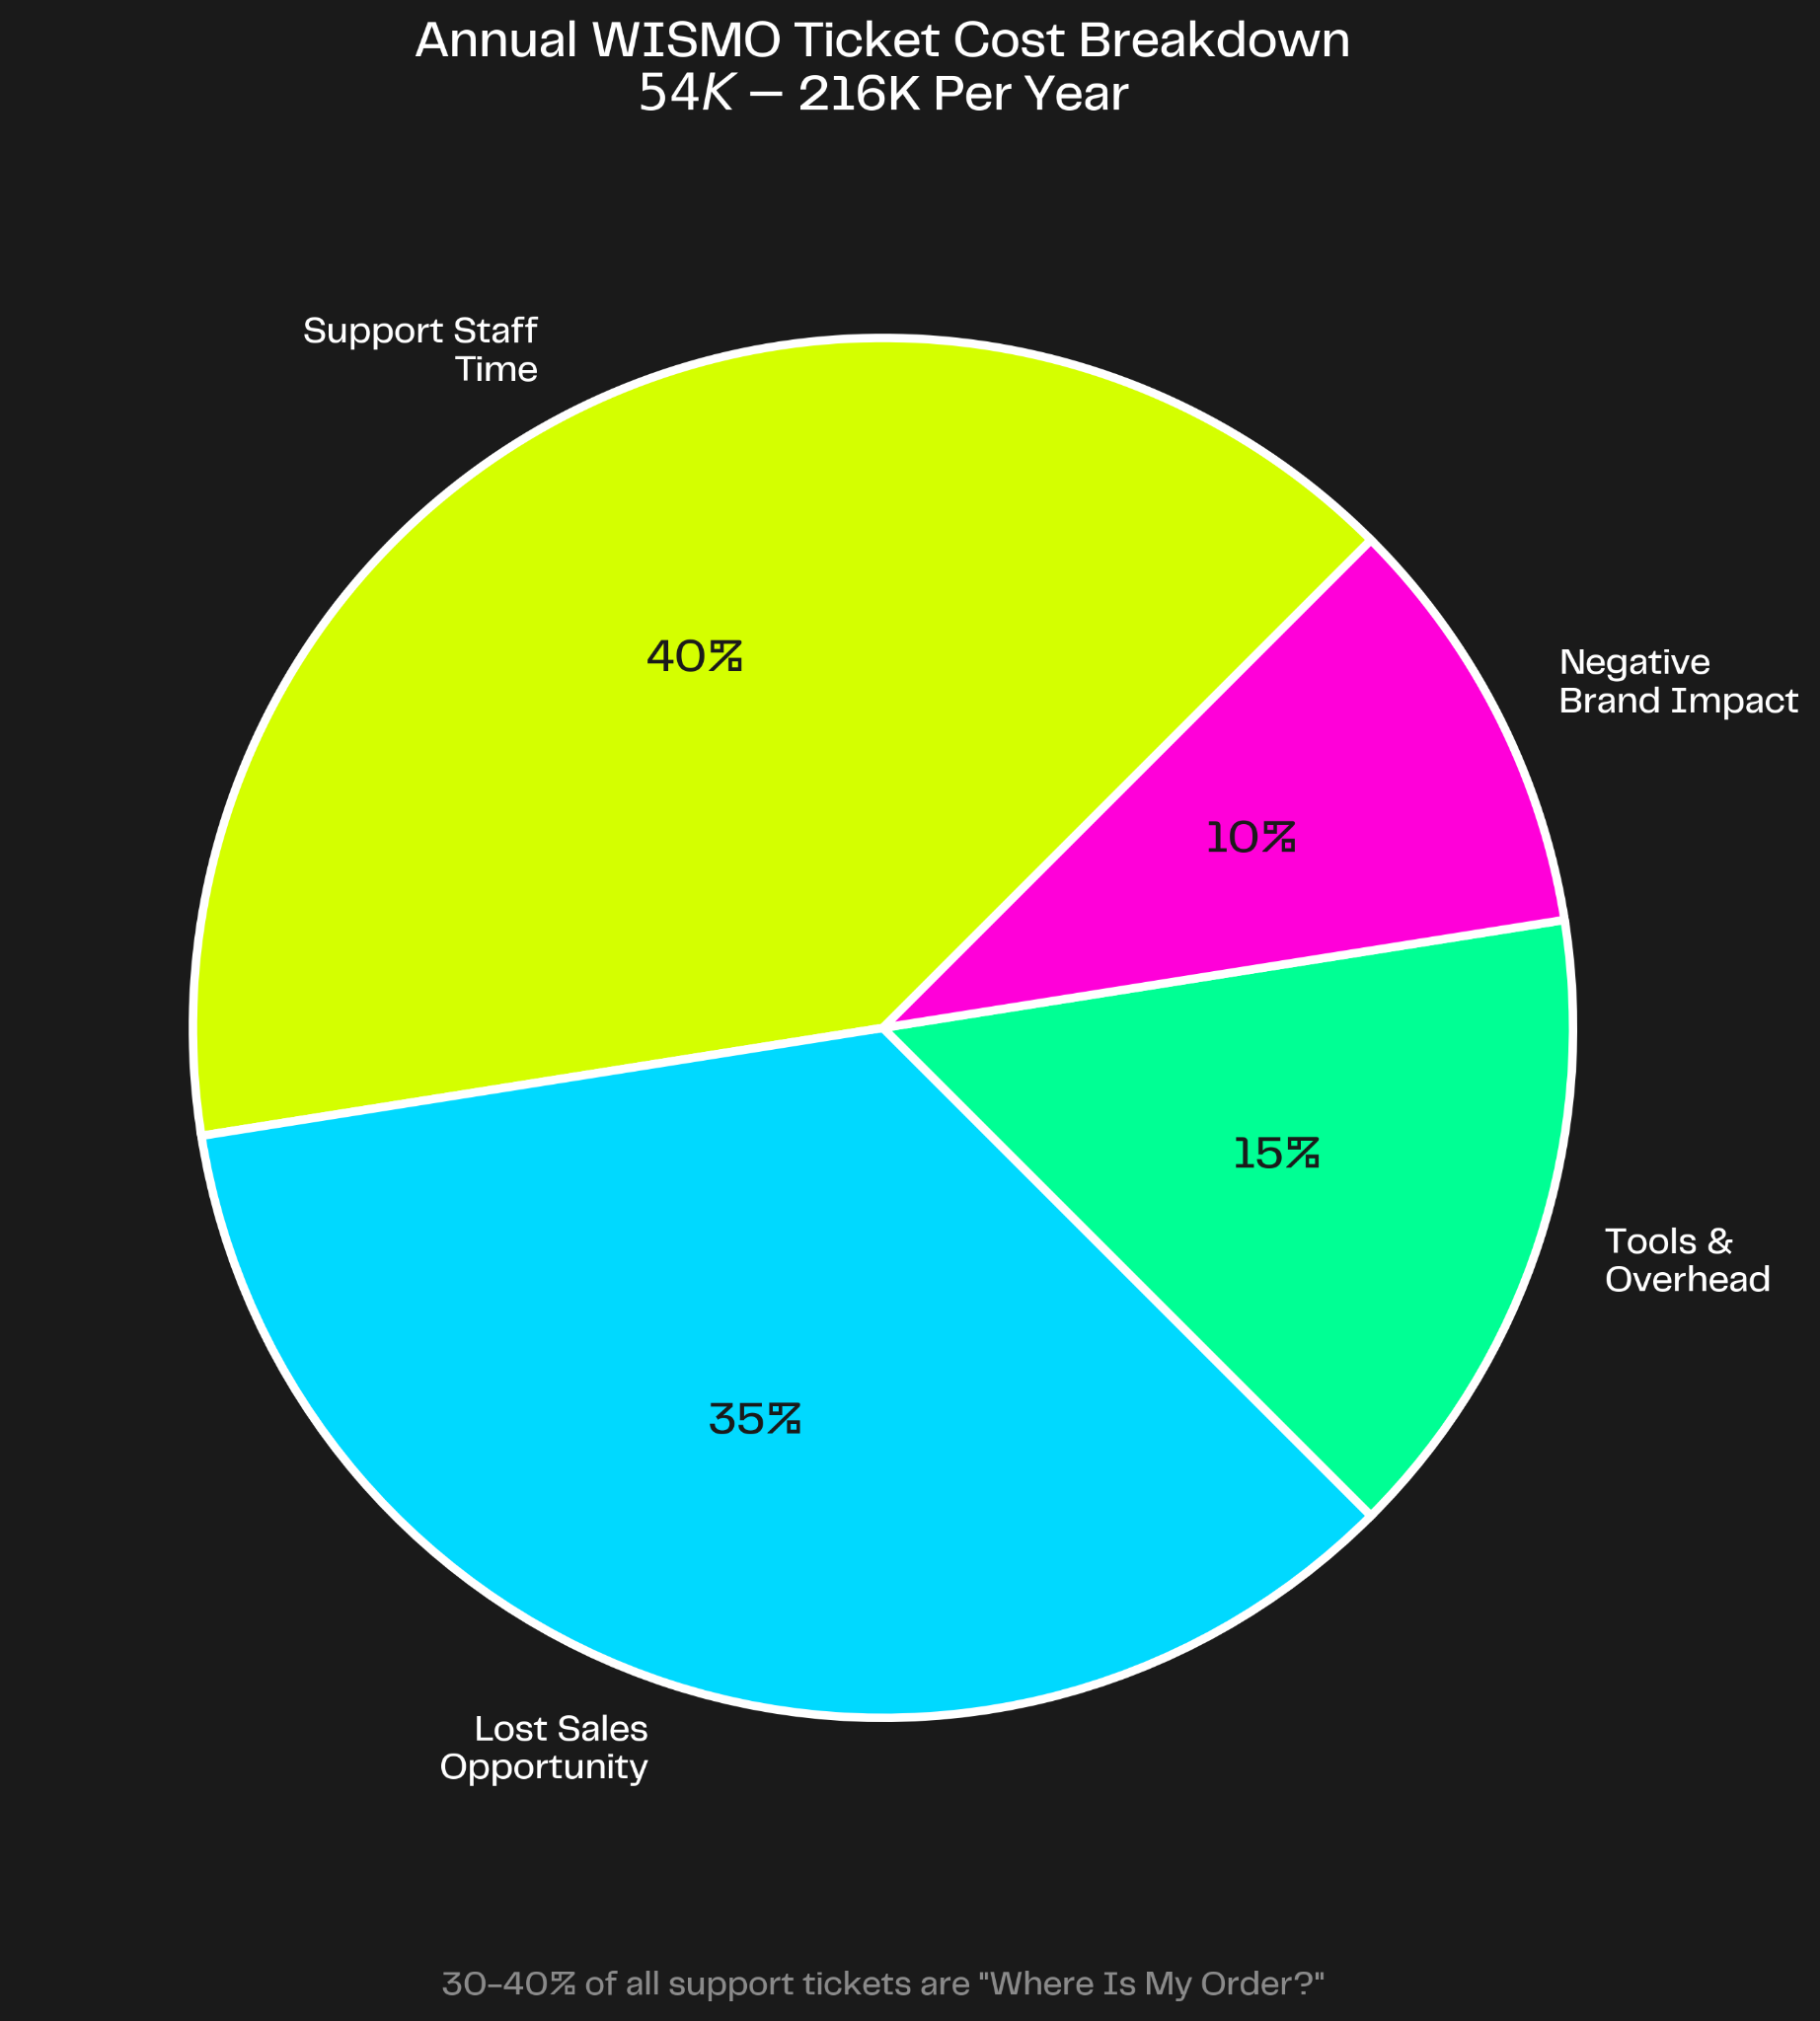
Thirty to forty percent of every logistics platform's support tickets are the same question: "Where is my order?”
These WISMO ("Where Is My Order?") inquiries aren't just annoying—they're expensive. The average logistics company spends between $54,000 and $216,000 annually just answering shipment status questions. Your support team becomes a glorified tracking hotline instead of focusing on complex customer issues that actually drive value.
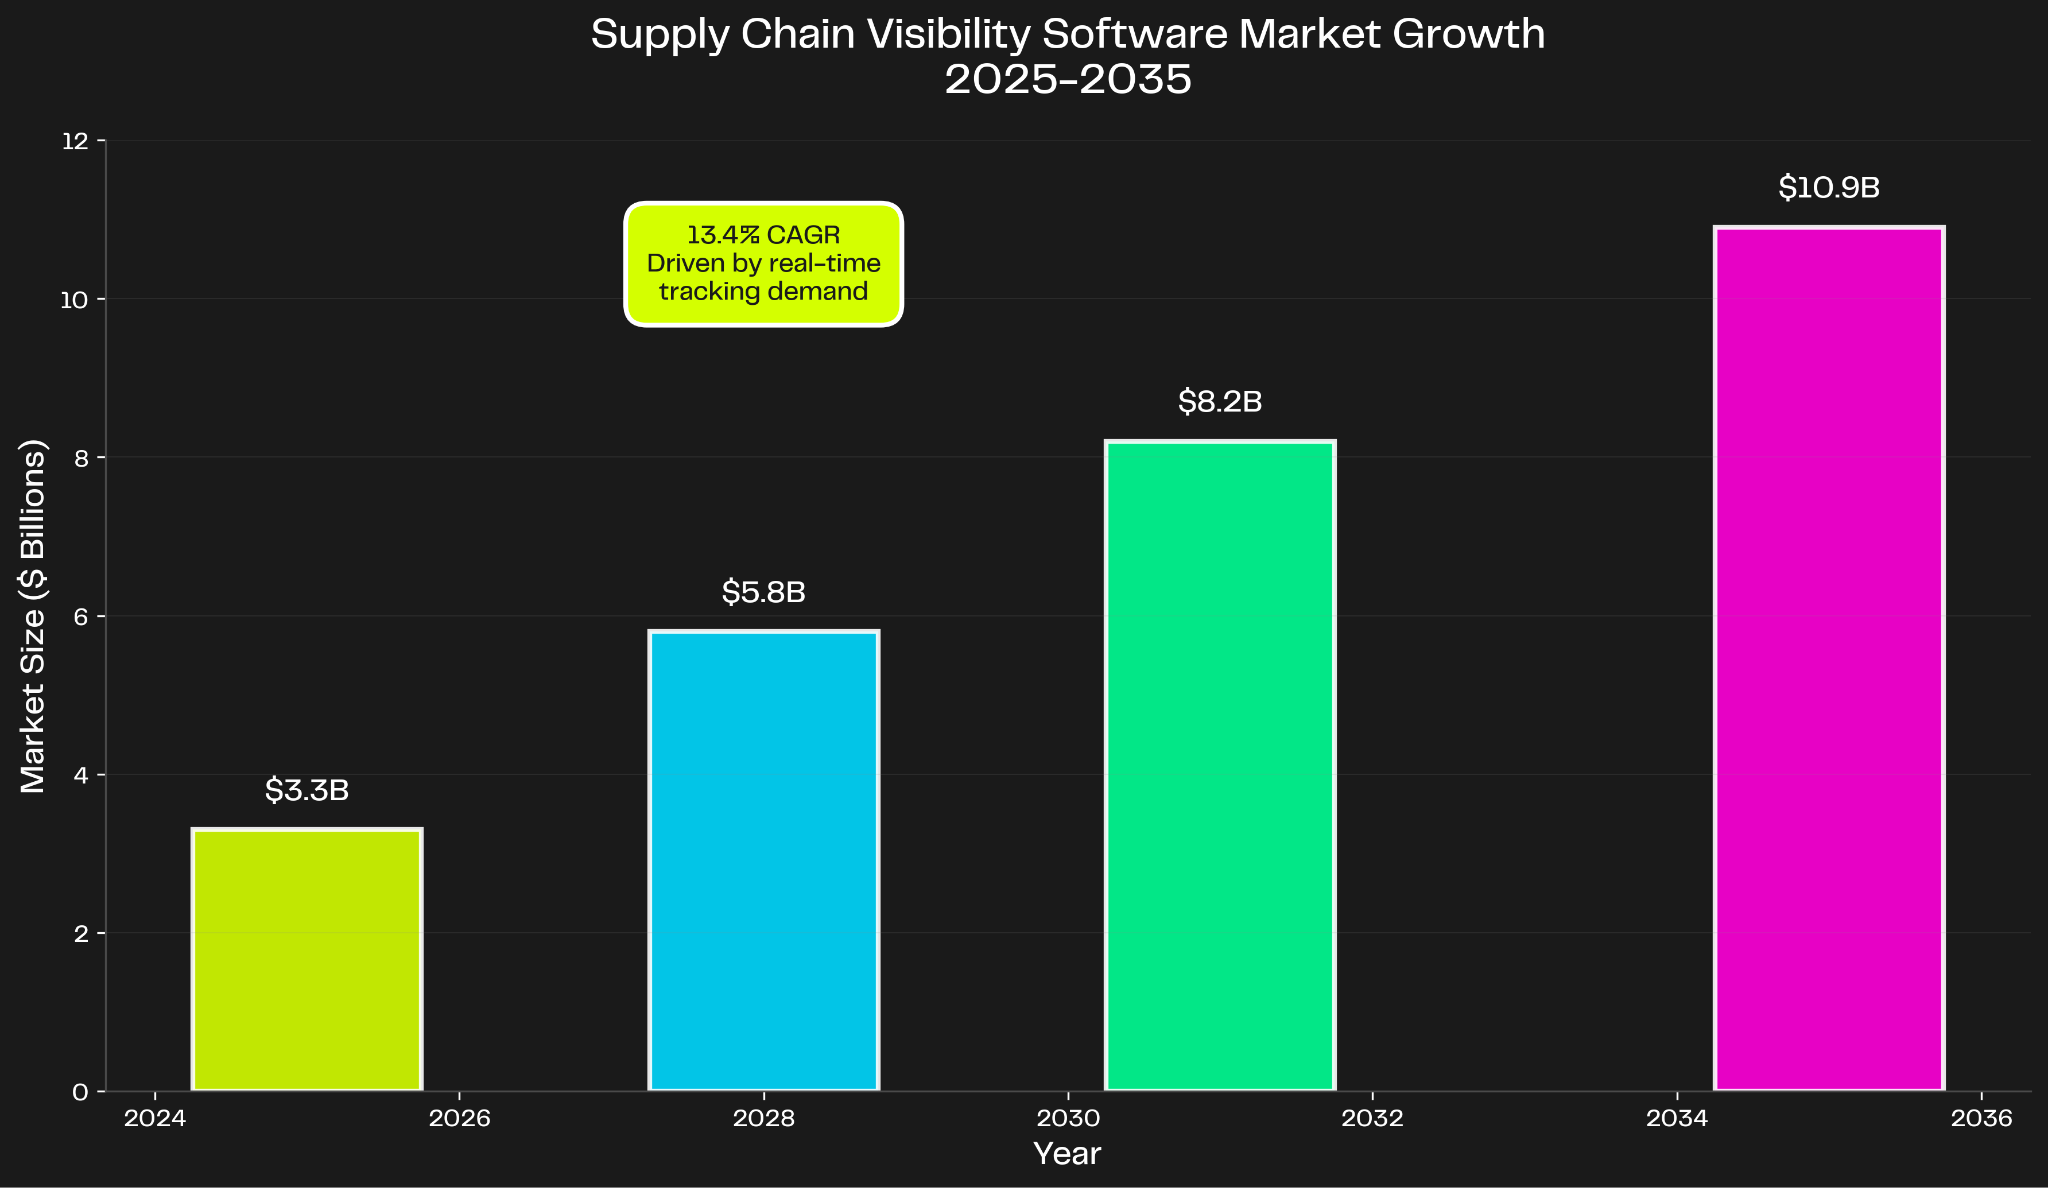
Meanwhile, only 13% of supply chain companies have achieved full end-to-end visibility. The other 87% are scrambling to catch up as customers demand real-time tracking, proactive notifications, and self-service portals. The supply chain visibility software market is exploding—from $3.3 billion in 2025 to a projected $10.9 billion by 2035, growing at 13.4% annually.
For logistics software platforms, customer-facing analytics aren't optional anymore. They're table stakes. Your customers—shippers, carriers, 3PLs, freight brokers—expect to answer their own questions about shipment status, carrier performance, and warehouse operations without picking up the phone.
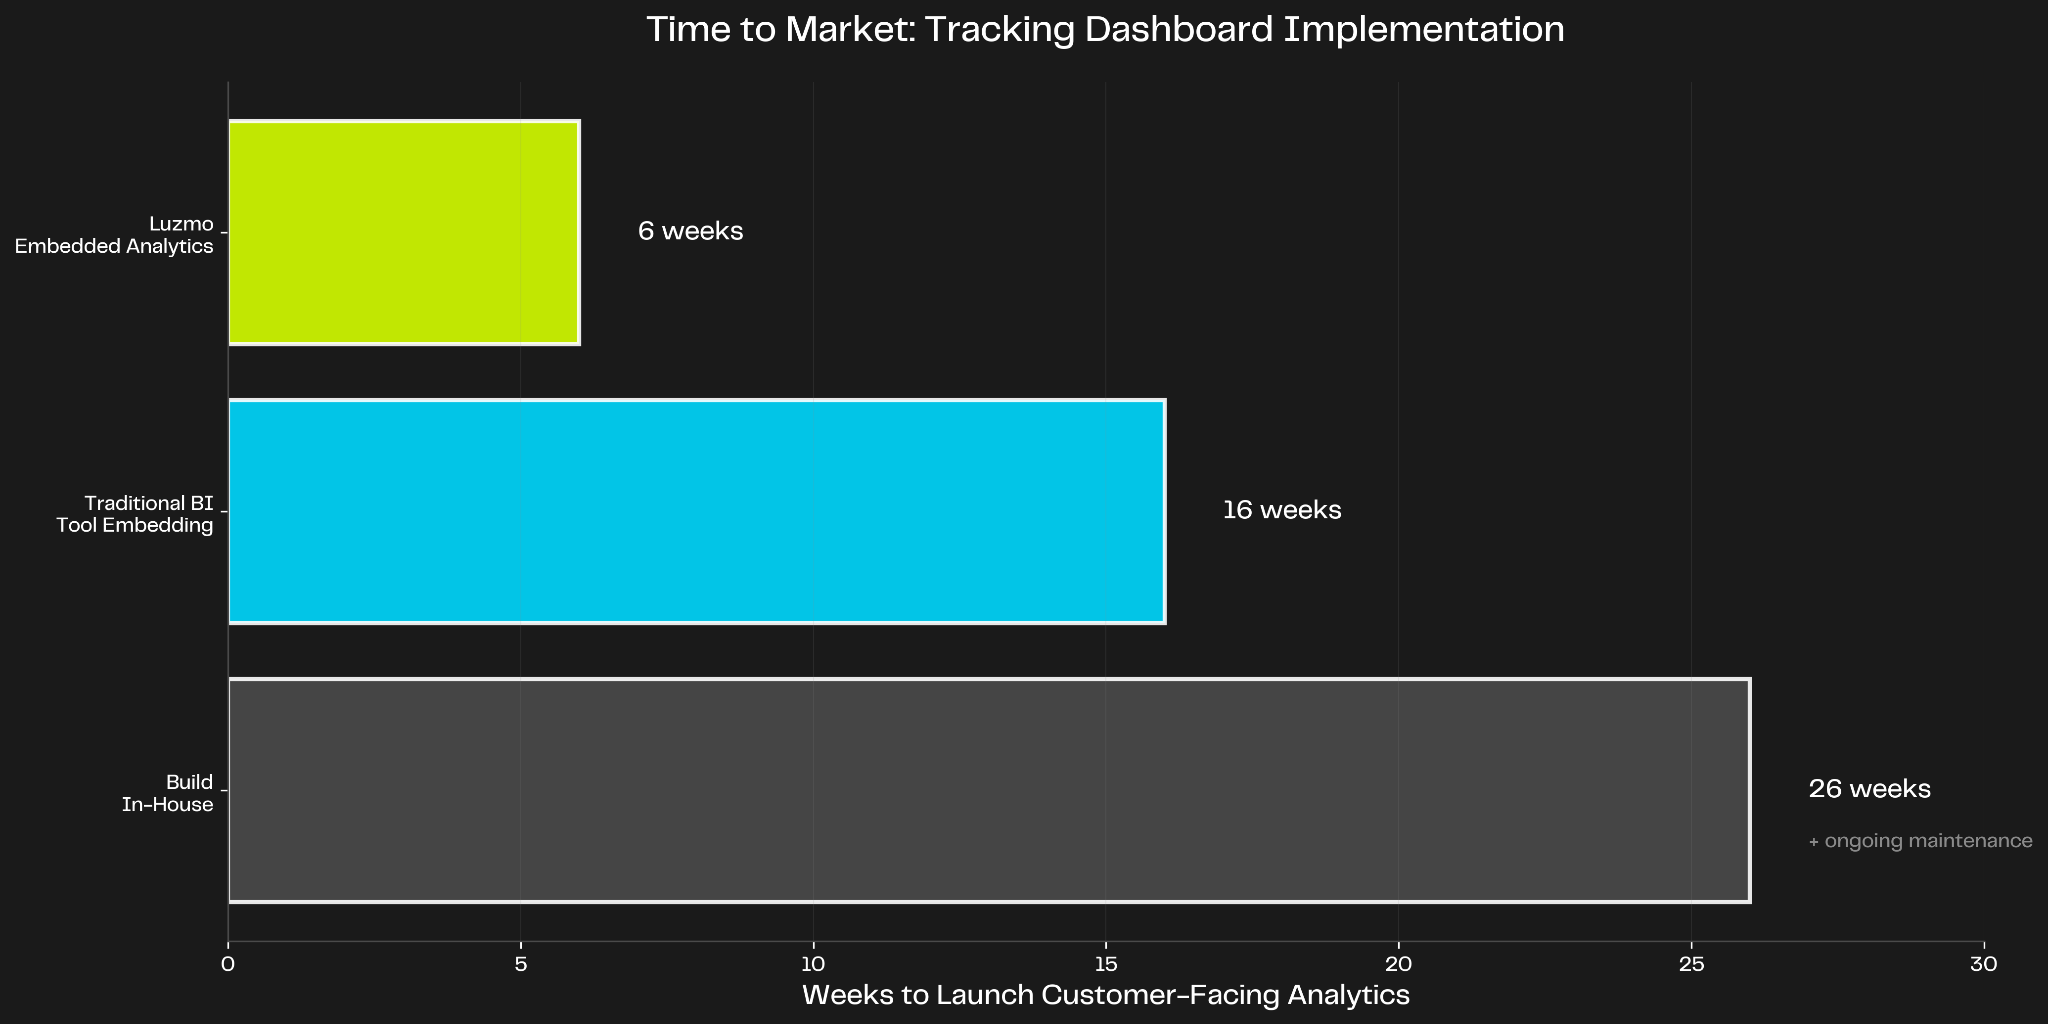
Building these analytics dashboards in-house takes 6-12 months of engineering time, plus ongoing maintenance that distracts from your core product. Traditional BI tools weren't built for customer-facing use cases, leaving you wrestling with white-label limitations and clunky iframe embeds that kill your user experience.
This article shows how modern supply chain platforms use embedded analytics to ship real-time tracking features in weeks instead of months, slashing support costs while creating stickier products that customers can't live without.
Here's what your support queue looks like right now: endless variations of "Where is shipment #12345?" and "Why is my delivery delayed?" These aren't complex questions requiring human judgment—they're data lookup queries that should never reach a human agent.
The cost breakdown is brutal. If your platform handles 100 support tickets daily and 35 of them are WISMO inquiries, you're spending $150-$600 per day ($4,500-$18,000 monthly) just answering tracking questions. Scale that across the year and you're looking at six figures in completely avoidable support expenses.
But the financial damage goes beyond direct support costs. Seventy-eight percent of manufacturers report visibility gaps across their supplier networks, and 64% experienced increased supply chain disruptions in 2024. When your customers can't self-serve tracking information, they're calling your support team. When they can't get instant answers, they're churning to competitors who offer better transparency.
The post-purchase experience has become a battleground. Customers who don't receive proactive shipment updates are less likely to use your platform again. One e-commerce retailer reduced WISMO support tickets by 60% simply by implementing automated shipment notifications, saving over $150,000 annually.
Your support team wasn't hired to be a tracking hotline. They should be solving complex logistics challenges, managing exceptions, and building customer relationships—not reading carrier status codes off a screen fifty times per day.
Modern logistics platforms face a common set of technical hurdles when building customer-facing analytics. Let's break down how embedded analytics addresses each one.
Building a real-time shipment tracking dashboard from scratch is a months-long engineering project. You need to integrate carrier APIs (FedEx, UPS, DHL, regional carriers), handle webhook events, normalize data formats, build the visualization layer, add filtering and search, and make it performant at scale.
The median timeline for building this in-house is 6-12 months, assuming you have available engineering resources and don't hit unexpected API quirks or performance issues, while also enabling integration with emergency management software to enhance real-time visibility and response to disruptions. Then comes ongoing maintenance: carrier API changes, new feature requests, performance optimization, and bug fixes.
Embedded analytics platforms flip this timeline. With pre-built web components and SDKs, you can embed interactive tracking dashboards in your product within weeks. Connect your data sources (carrier APIs, warehouse management systems, transportation management systems), configure the visualization layer using a no-code builder, and customize to match your brand.
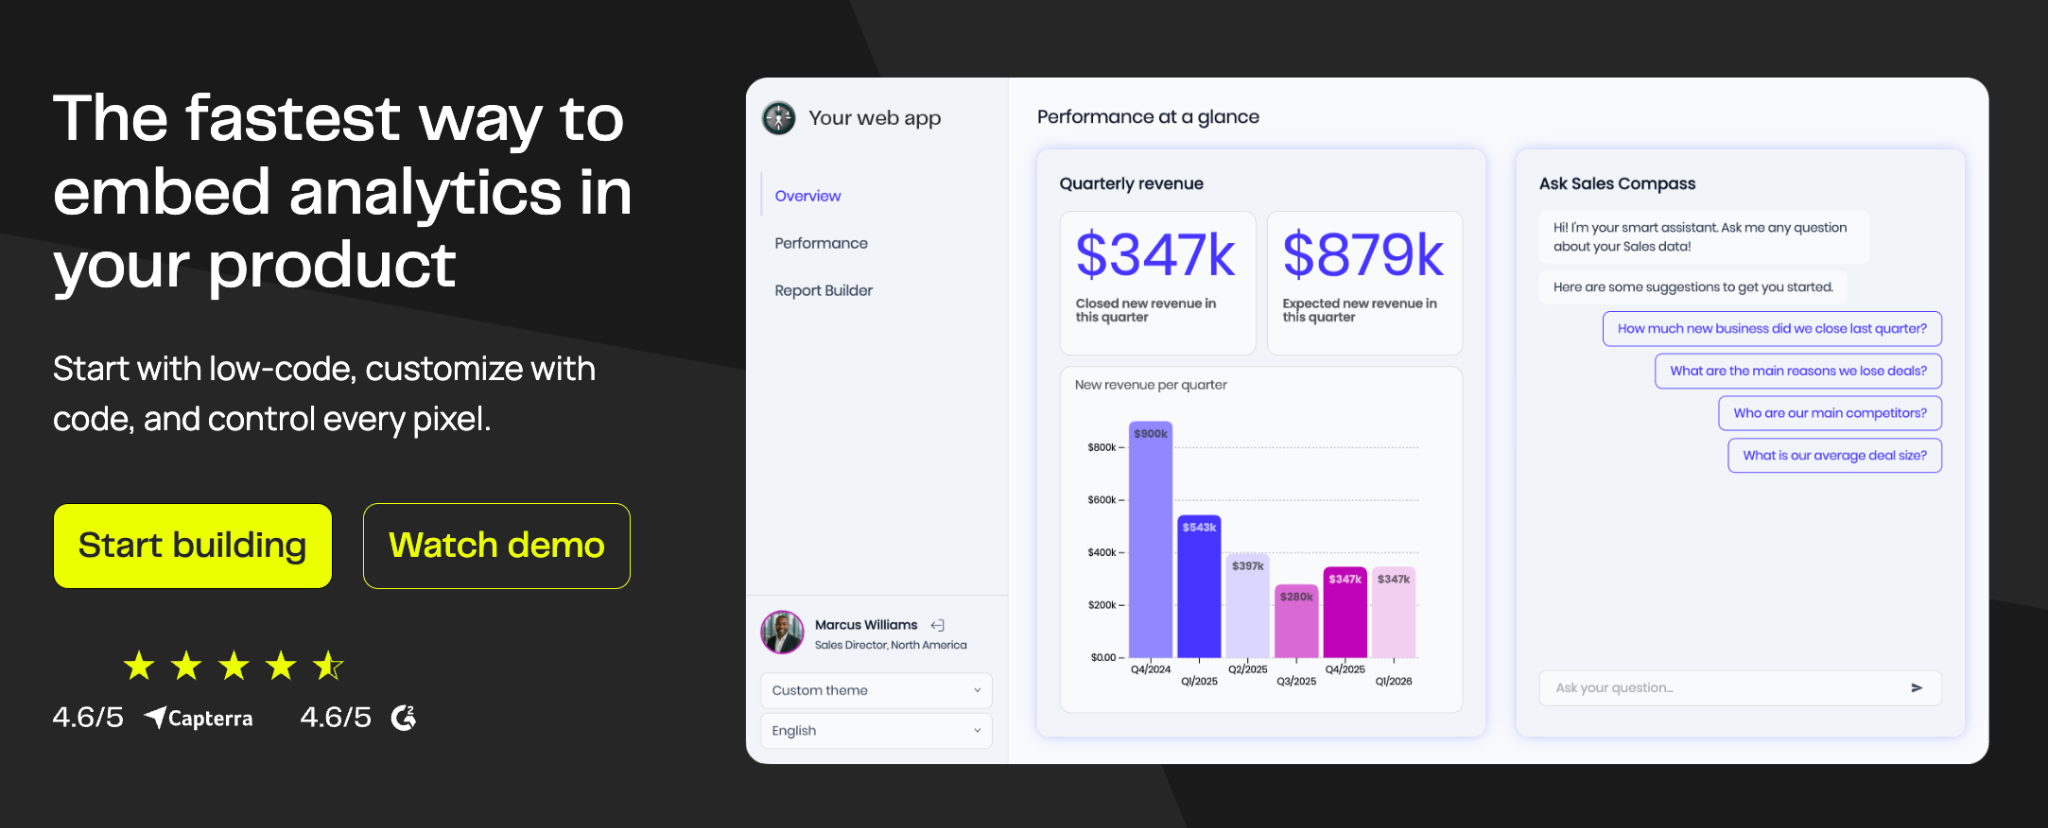
Luzmo's web components approach means dashboards load natively in your application's DOM—no janky iframes that break your UX and limit customization. Luzmo Warp accelerates real-time data synchronization so your tracking updates appear instantly, not on a polling delay that frustrates users refreshing the page.
Every customer on your logistics platform needs isolated data views. Shipper A shouldn't see Shipper B's shipment data. Carrier performance metrics need to be sandboxed by customer account. Warehouse dashboards require row-level security to ensure operations managers only see their facility's data.
Building robust multi-tenancy is complex. You need database-level isolation, query filtering, user permissioning, and audit logging. Get it wrong and you've got a data leak that destroys customer trust and potentially violates compliance requirements.
Embedded analytics platforms handle multi-tenancy architecture out of the box. Row-level security automatically filters data based on user context. Tenant isolation ensures customers only access their own shipment data. Onboarding a new logistics partner doesn't require rebuilding your data model—you configure tenant parameters and their dashboards work immediately.
This becomes critical when you're scaling from dozens to hundreds of customers. Manual tenant provisioning doesn't scale. Automated multi-tenant architecture does.
Generic carrier tracking pages are terrible for your brand. Customers leave your platform, land on a UPS or FedEx tracking page full of competitor ads and zero brand reinforcement, and maybe—maybe—they remember to come back to your platform.
You've invested in acquiring that customer. You've built a beautiful product experience. Then you hand them off to a carrier's generic tracking page that looks nothing like your brand and offers no additional services you could upsell.
White-label analytics keep customers in your ecosystem. Fully customizable dashboards match your color scheme, typography, and design system. Customers see tracking updates in an interface that feels native to your product, not bolted on as an afterthought.
The post-purchase experience becomes a brand touchpoint instead of a leak in your customer journey. Research shows that companies using branded tracking pages see customer engagement rates increase by 25%, with customers more likely to explore other platform features while checking shipment status.
Luzmo's Flex SDK gives you complete design control. You're not stuck with out-of-the-box dashboard templates that scream "third-party tool." Your tracking interfaces look like they were built by your design team because you have full control over styling and component layout.
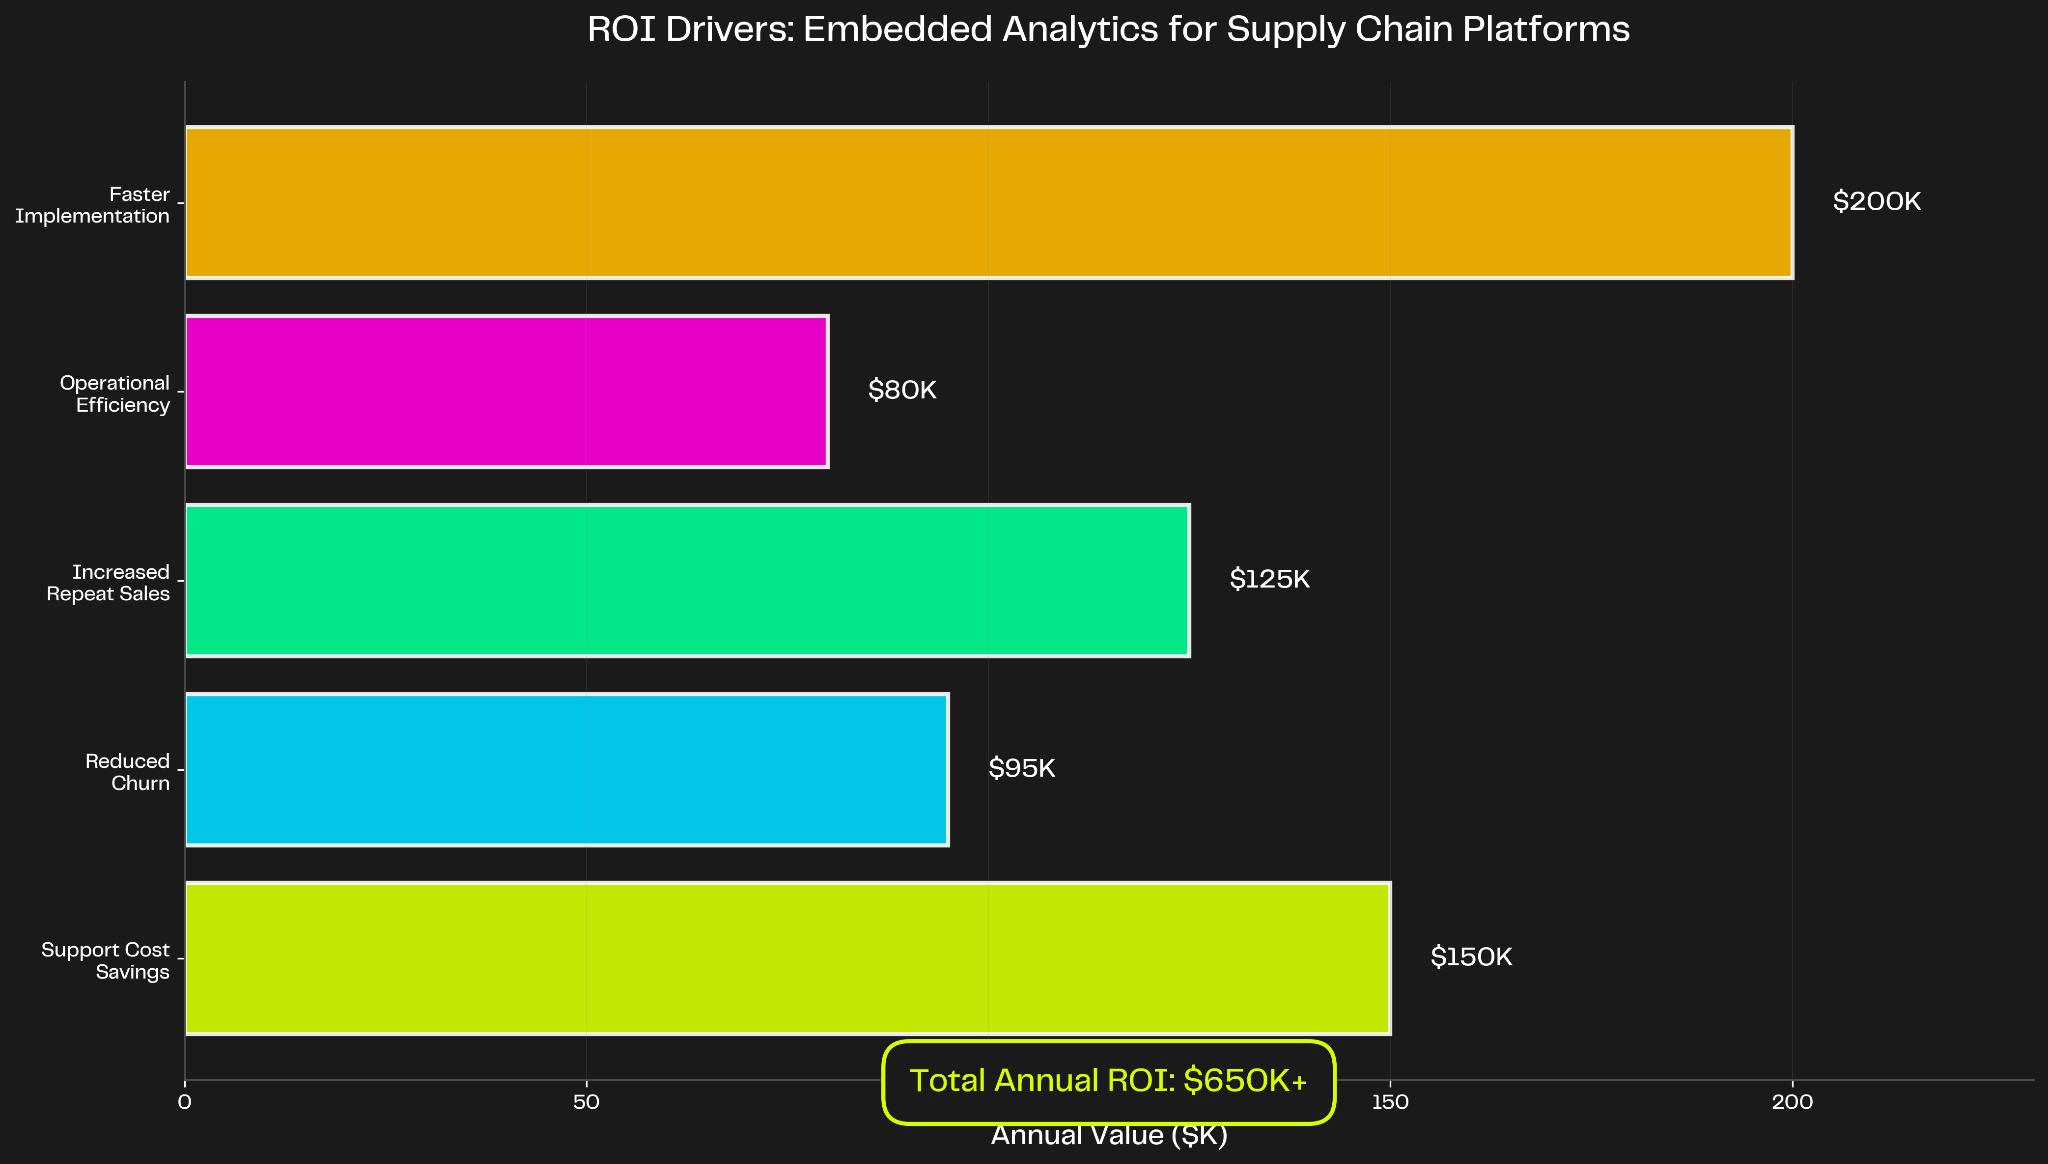
The ROI story is simple: every WISMO question answered by a dashboard instead of a support agent saves you $5-15 per ticket. Multiply that across thousands of monthly inquiries and you're looking at six-figure annual savings.
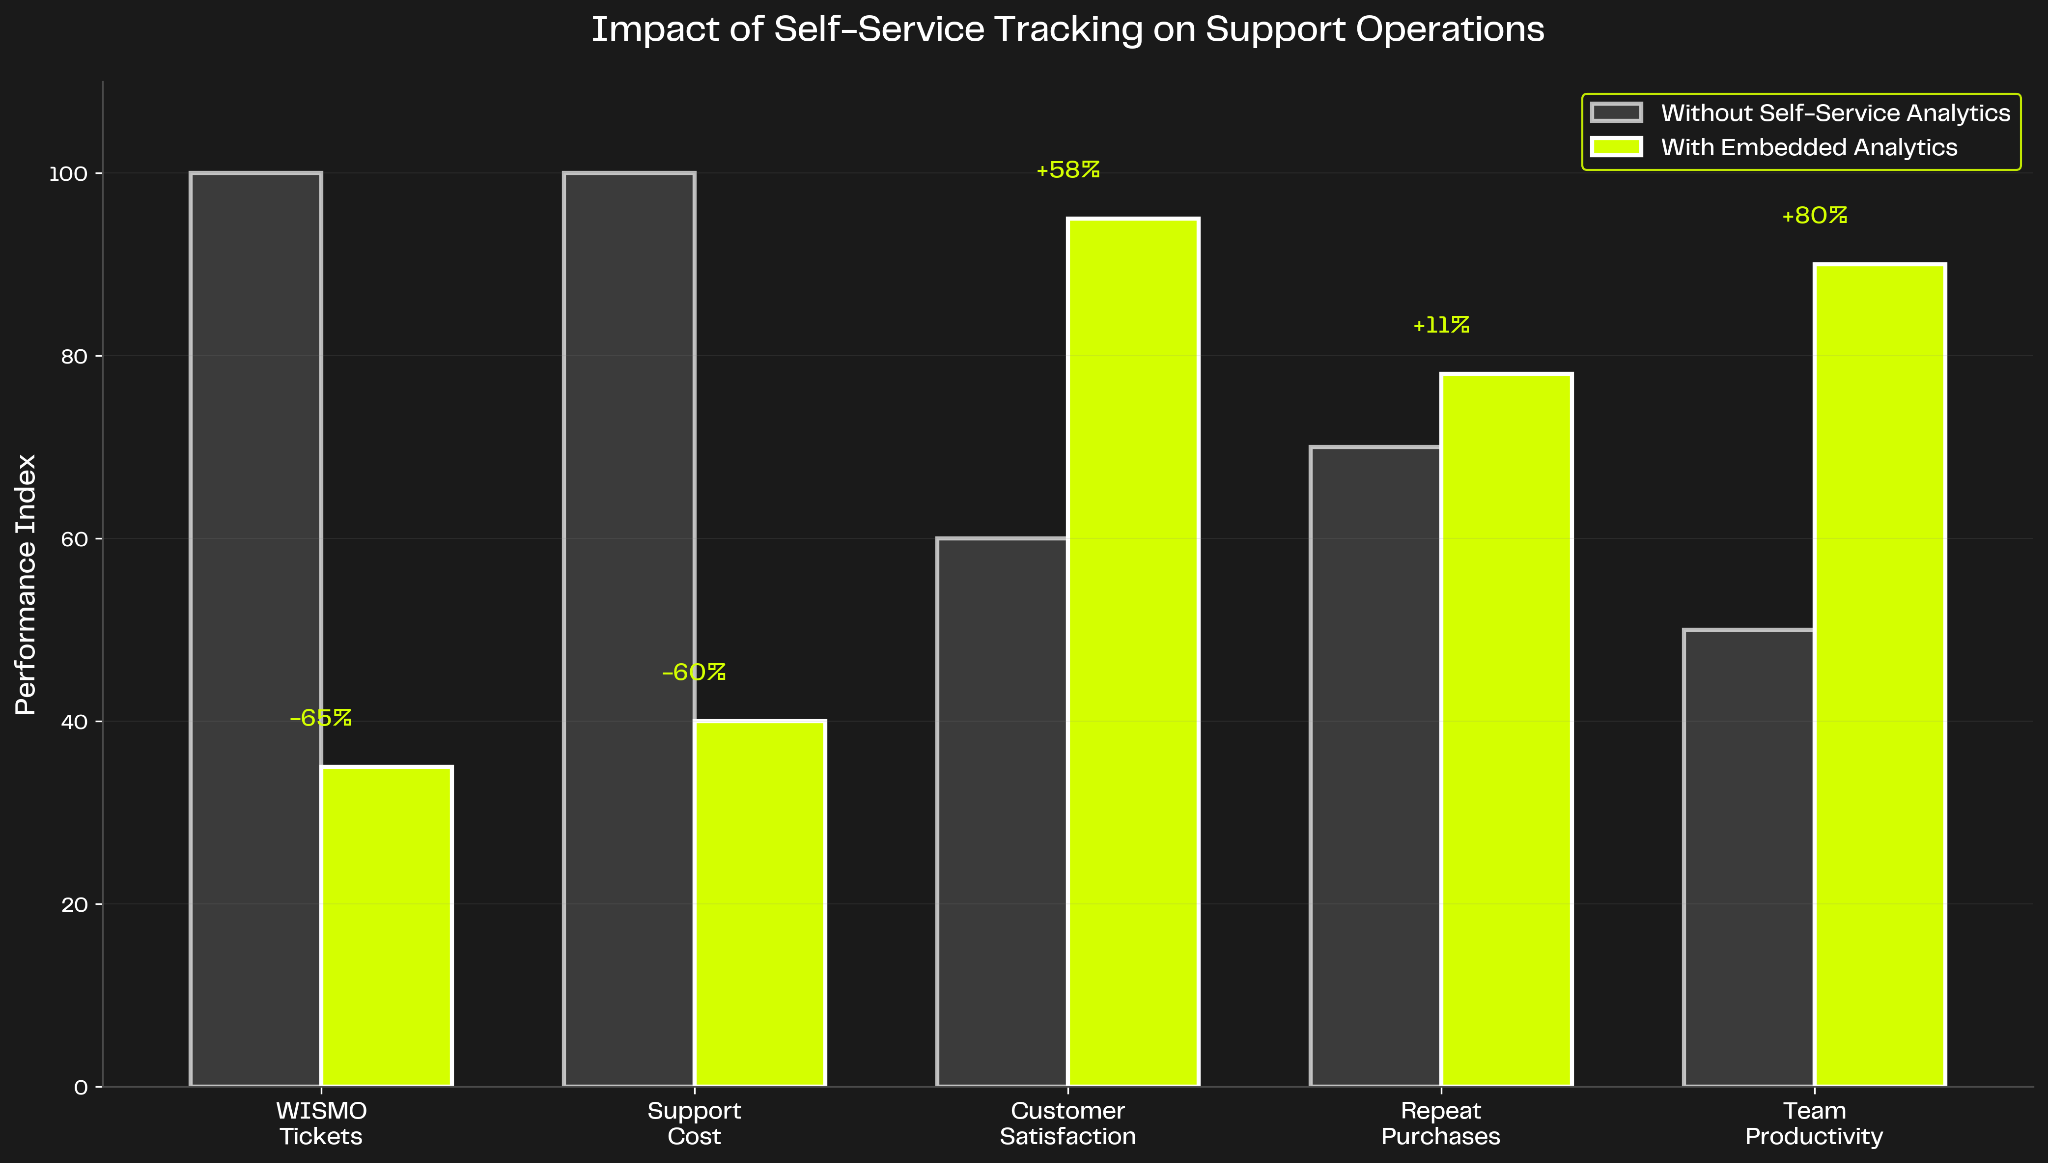
Platforms that implement proactive shipment tracking with real-time updates reduce WISMO tickets by 60-70%. That's not incremental improvement—that's transformational change in your support operations.
Self-service dashboards let customers answer their own questions. Where is my shipment? (Live tracking map shows location.) Which carrier is delivering? (Carrier performance dashboard shows all active routes.) Why was delivery delayed? (Exception alerts explain delays before customers call.)
But the benefits extend beyond cost savings. Support teams freed from answering repetitive tracking questions can focus on high-value interactions: resolving complex issues, onboarding new customers, and identifying opportunities for account expansion. Customer satisfaction improves when support agents have time to actually solve problems instead of reading status codes.
One freight broker implemented embedded analytics and saw their Net Promoter Score increase by 18 points within six months. Customers loved having instant access to lane profitability data, carrier performance comparisons, and shipment volume trends without submitting data requests and waiting for email reports.
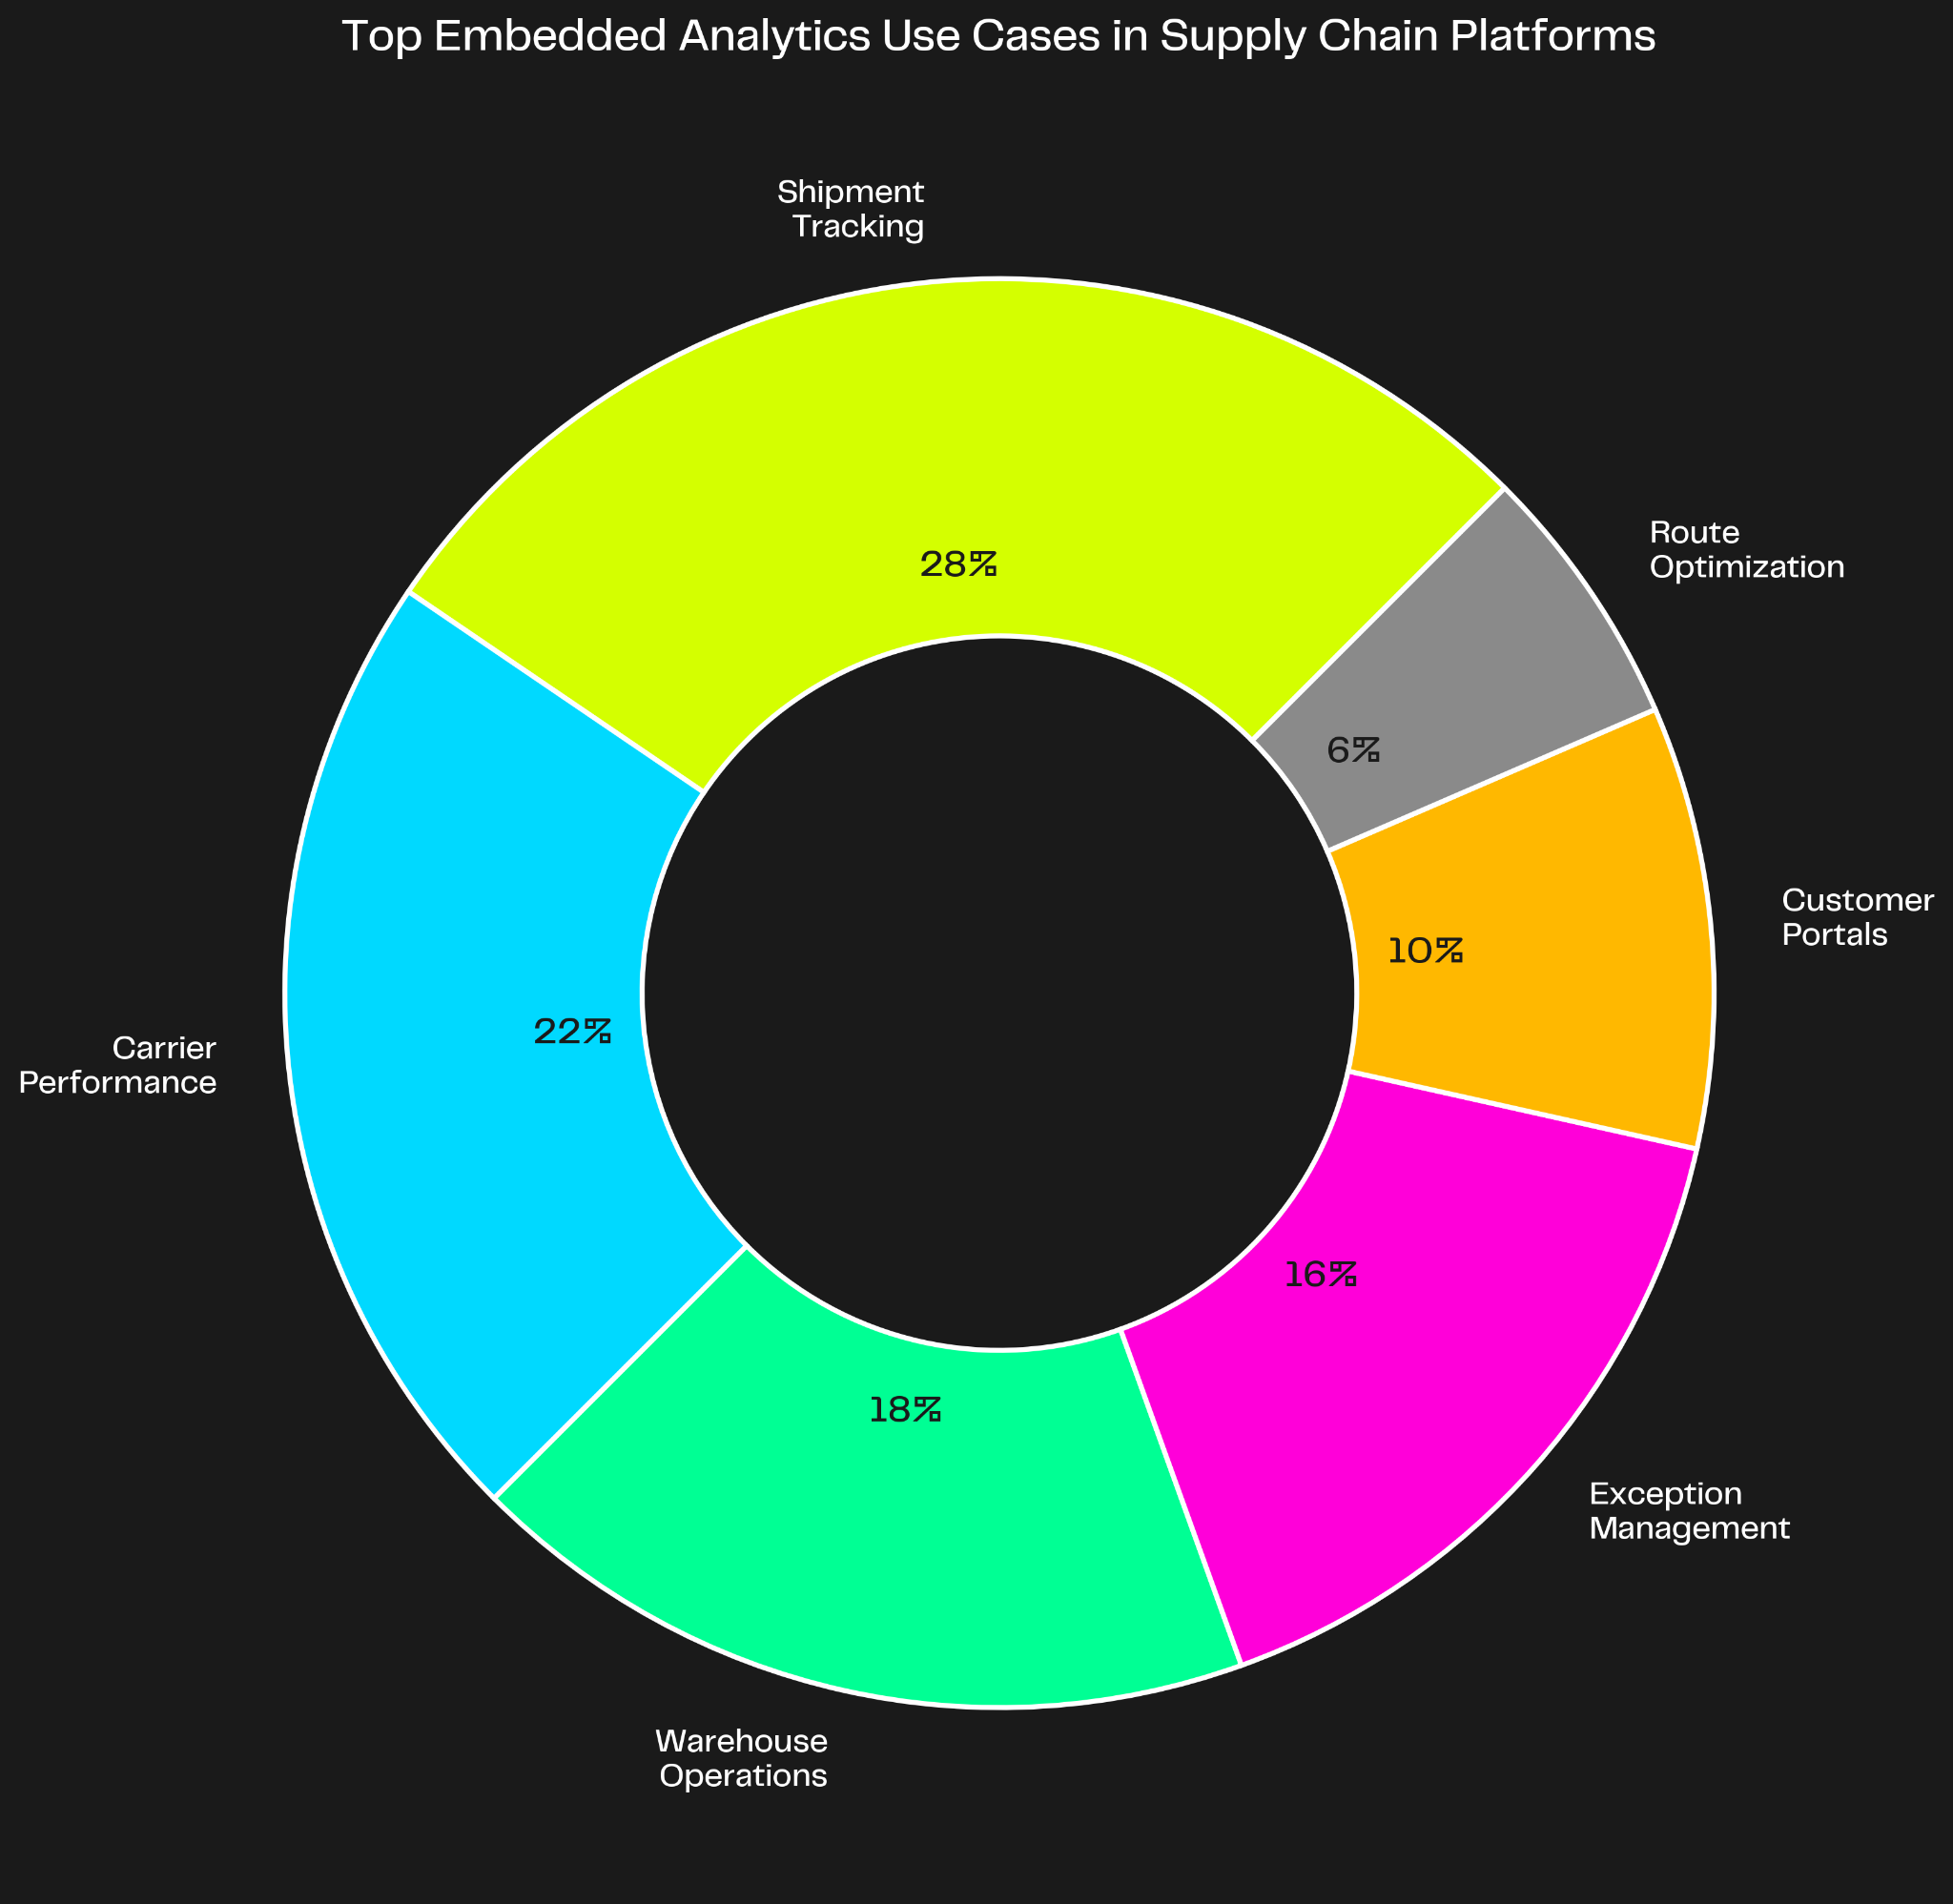
Real-world logistics platforms use embedded analytics for five core use cases. Each addresses a specific customer pain point and reduces manual support burden.
This is the table-stakes analytics feature. Live GPS location, estimated delivery times, proof of delivery documentation, and shipment status updates all in one dashboard.
A mid-sized 3PL embedded real-time tracking in their customer portal and reduced WISMO support tickets by 60%, saving $150,000 annually while improving customer satisfaction scores. Customers could see exactly where their freight was at any moment, with automatic SMS notifications for delivery exceptions.
Shippers need to compare carrier performance to optimize their transportation spend. Which carriers have the best on-time delivery rates? Where are exception rates highest? How do costs vary across lanes and service levels?
Freight brokers use carrier performance dashboards to identify underperforming partners and renegotiate contracts based on data. One broker optimized lane profitability by 15% after implementing carrier scorecards that tracked on-time performance, damage rates, and cost per shipment across their network.
E-commerce fulfillment platforms and last-mile delivery services need branded tracking pages that customers can access without logging into the main platform. These portals provide order lookup by tracking number, real-time delivery status, estimated arrival windows, and carrier contact information.
An e-commerce logistics platform integrated branded delivery portals and saw repeat purchase rates increase by 8%. The branded tracking experience reinforced their value proposition while keeping customers engaged during the post-purchase window when many competitors lose attention.
Third-party logistics providers (3PLs) managing multiple warehouses need operational visibility into pick/pack efficiency, inventory accuracy, zone utilization, and fulfillment speed. Operations managers use these dashboards to identify bottlenecks and optimize labor allocation.
A national 3PL built warehouse performance dashboards for their facility managers and improved fulfillment speed by 25%. Real-time visibility into order queues, worker productivity, and shipping deadlines allowed managers to reallocate resources dynamically instead of reacting to end-of-shift reports.
Proactive exception management prevents small issues from becoming customer escalations. Automated alerts for delayed shipments, failed delivery attempts, damaged goods, and address validation errors let logistics coordinators intervene before customers notice problems.
A supply chain platform reduced missed SLA commitments by 40% after implementing exception dashboards with automated workflow triggers. When a shipment risked missing its delivery window, the system automatically notified the account manager and suggested alternative routing options.
Logistics platforms generate massive amounts of data—shipment events, GPS coordinates, carrier updates, warehouse scans, and customer interactions. The challenge isn't data volume; it's surfacing the right insights at the right time.
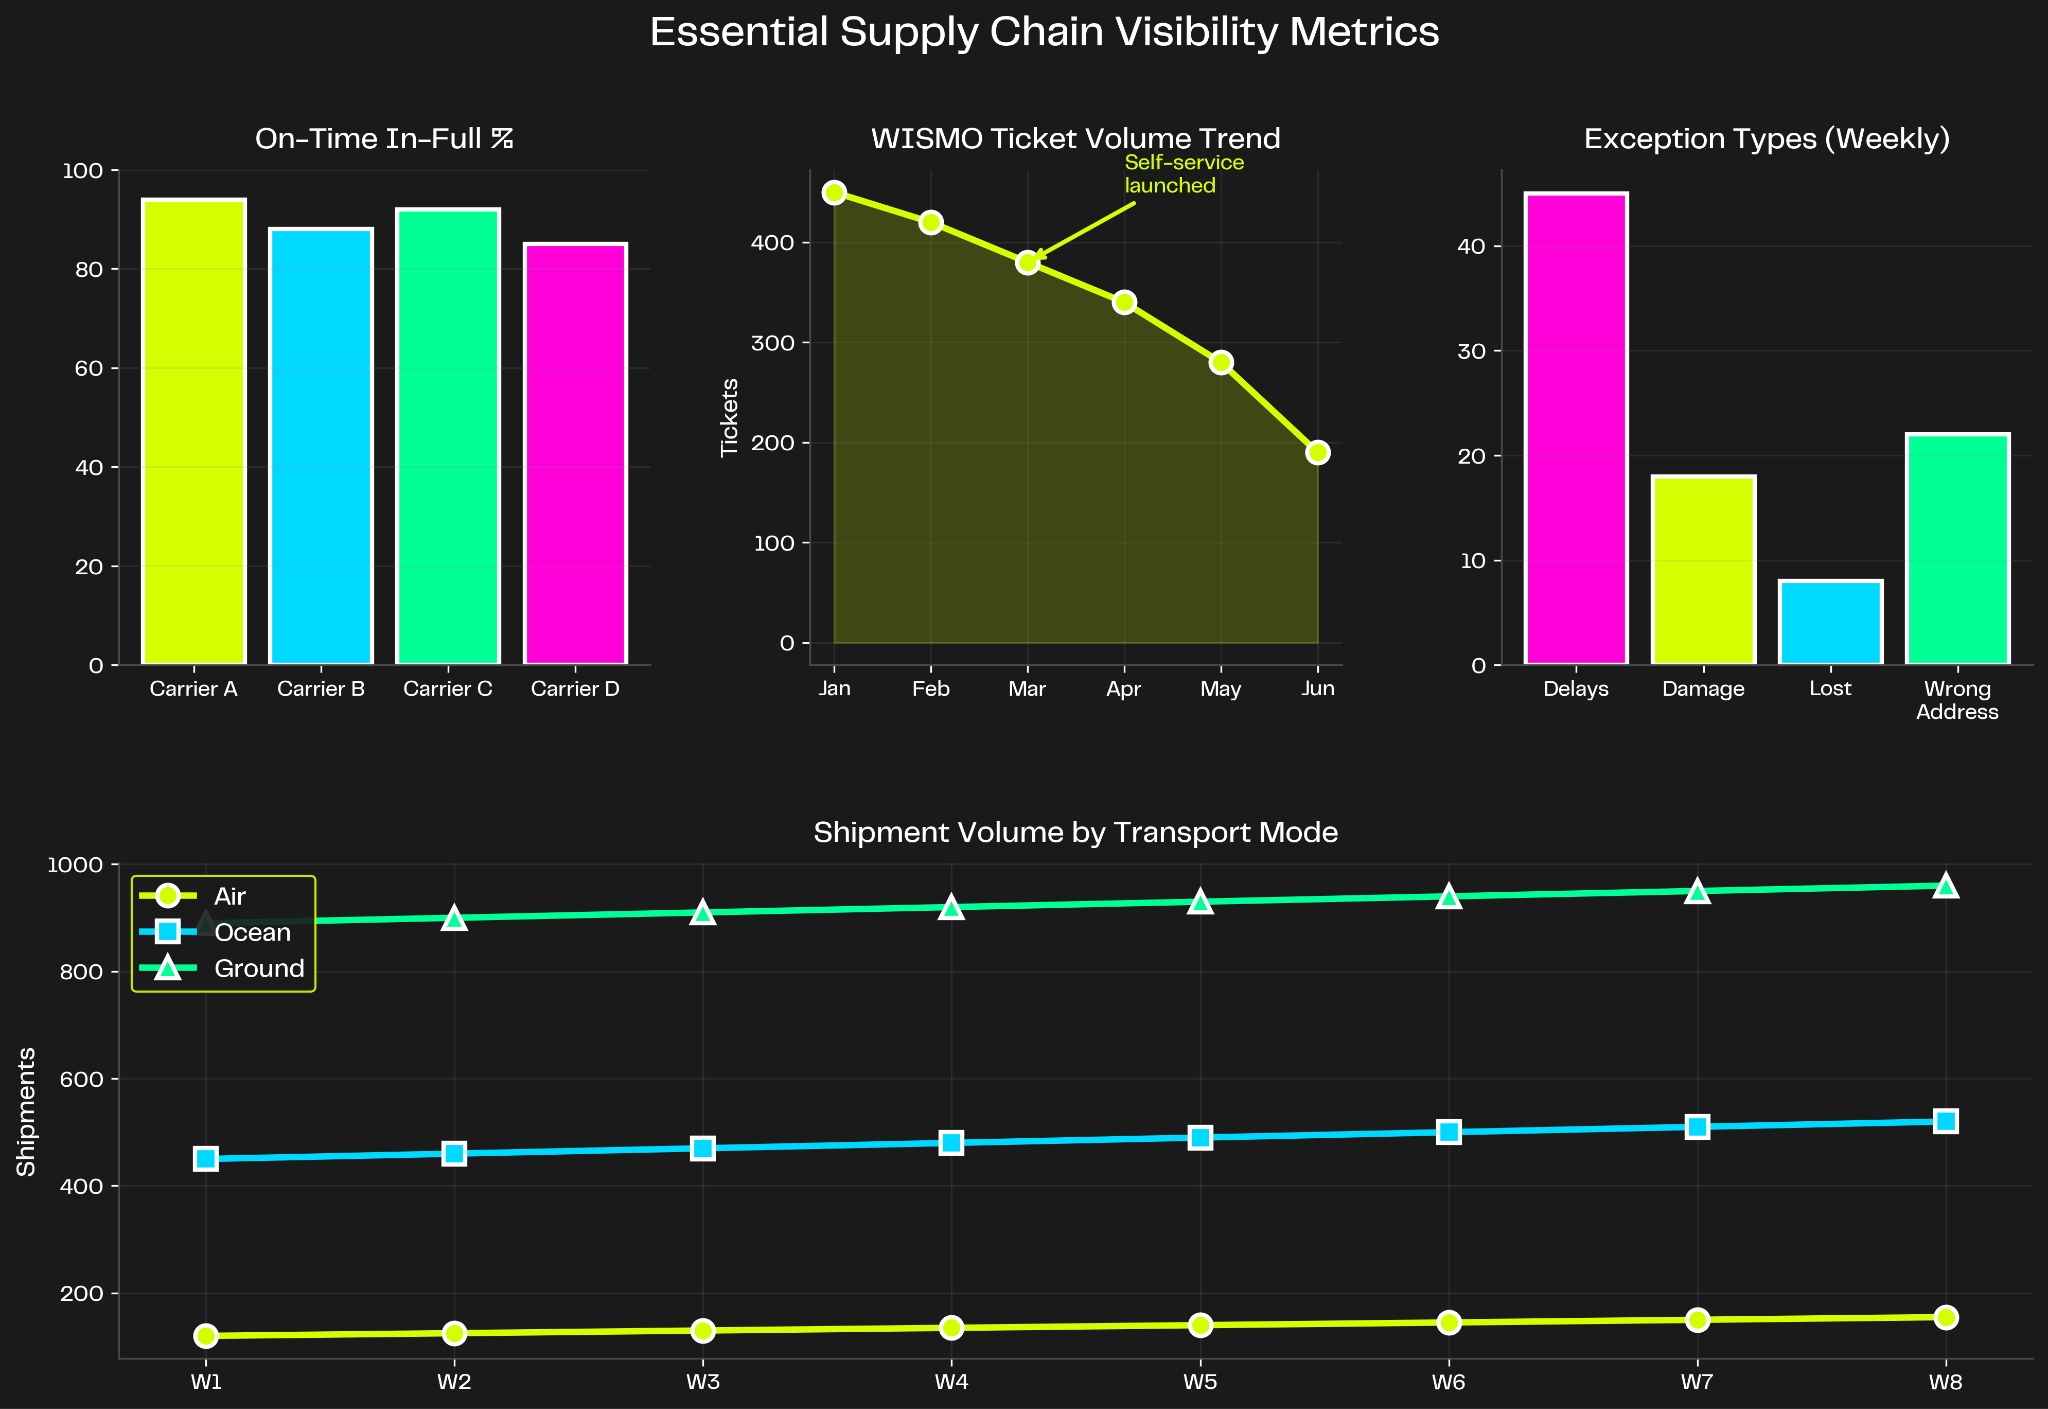
Operational metrics that matter: On-time delivery percentage (OTIF), transit time variance, exception rate by carrier, cost per shipment, and warehouse pick/pack accuracy. These KPIs drive daily operational decisions and help logistics managers optimize routes, allocate resources, and manage carrier relationships.
Customer experience metrics: WISMO ticket volume trends, delivery satisfaction scores, tracking page engagement rates, and proactive notification effectiveness. These metrics show whether your self-service analytics are actually reducing support burden and improving customer satisfaction.
Business intelligence for strategic planning: Revenue by shipping lane, carrier performance comparisons for contract negotiations, peak volume forecasting to plan warehouse capacity, and warehouse utilization trends to identify expansion needs.
The best logistics platforms don't just display these metrics—they make them actionable. Clicking on an underperforming carrier routes to detailed exception analysis. Hovering over a delayed shipment shows alternative routing options. Drilling into warehouse utilization reveals which SKUs are consuming the most space.
Luzmo IQ adds natural language querying so logistics coordinators can ask "Which carriers have the worst on-time performance this month?" and get instant answers without building custom reports. This democratizes data access beyond analysts to frontline operations staff who need fast answers.
Let's be honest about what building customer-facing analytics in-house actually requires:
Time cost: 6-12 months to ship basic tracking dashboards. Your product roadmap gets delayed while engineering builds infrastructure that doesn't differentiate your core product. Plus, you're committing to ongoing maintenance: carrier API changes, performance optimization, bug fixes, and feature requests that never stop coming.
Feature gap: Multi-tenant architecture is complex. Thousands of customers with isolated data views require careful database design and query optimization. Real-time data synchronization is challenging when you're polling multiple carrier APIs with different rate limits and webhook implementations. White-label customization takes time—building a theming engine that lets customers match your dashboard to their brand identity isn't trivial. Advanced features like AI-powered predictive ETAs and natural language queries require machine learning expertise most logistics platforms don't have in-house.
Opportunity cost: While your engineers are building analytics infrastructure, they're not building the features that differentiate your core logistics platform. Your competitors are shipping carrier integrations, automated routing, and predictive exception management while you're stuck in dashboard hell.
The Luzmo advantage flips this timeline. Ship embedded analytics in weeks instead of months. No infrastructure maintenance burden—that's Luzmo's problem, not yours. Luzmo Warp handles real-time data acceleration so tracking updates appear instantly. Luzmo IQ provides natural language querying without building your own NLP engine. Your engineering team focuses on your core product while customers get the analytics they demand.
Here's what shipping customer-facing logistics analytics looks like with an embedded platform:
Week 1-2: Connect your data sources. Carrier APIs (FedEx, UPS, DHL, regional carriers), warehouse management system data, transportation management system records. Use pre-built connectors where available; build custom integrations for proprietary systems. Data flows into Luzmo's caching layer for instant query performance.
Week 3-4: Configure dashboards using the no-code builder. Drag and drop visualizations for shipment tracking maps, carrier performance comparisons, and warehouse operations metrics. Add filters so customers can drill down by date range, shipping lane, or carrier. Set up automated refresh intervals so data stays current.
Week 5-6: Customize white-label branding and set up multi-tenancy. Apply your color scheme, logo, and typography. Configure row-level security so each customer only sees their shipment data. Test tenant isolation to ensure data privacy.
Week 7-8: Launch customer-facing tracking portals. Embed dashboards in your existing application using web components. Add public tracking pages customers can access without logging in. Deploy proactive notifications for shipment exceptions.
Compare this to 6-12 months building in-house, plus ongoing maintenance overhead. The time-to-value difference is dramatic. You're delivering customer-facing analytics while competitors are still scoping requirements.
Supply chain visibility isn't a nice-to-have feature anymore—it's expected infrastructure. Seventy-four percent of organizations cite digital transformation as the primary driver for investing in visibility software. Customers won't tolerate logging into separate carrier websites to track shipments or waiting for email status updates.
The platforms winning in logistics are the ones that make data accessible, actionable, and self-service. WISMO tickets drop when customers can track shipments in real-time. Churn decreases when branded portals keep customers engaged during the post-purchase experience. Support teams become strategic when they're freed from answering repetitive tracking questions.
Building this infrastructure in-house takes months and pulls engineering resources away from your core product. Embedded analytics platforms let you ship customer-facing dashboards in weeks, with no maintenance burden and advanced features like AI-powered insights and natural language querying built in.
The supply chain platforms that scale are the ones that recognize analytics as core infrastructure, not a feature to build someday when engineering capacity opens up. By the time you finish building in-house, your competitors have already shipped embedded analytics and are offering the self-service experience your customers demand.
Real-time tracking. Carrier performance analytics. Warehouse operations dashboards. Exception management. These aren't future roadmap items—they're table stakes. The only question is whether you'll spend a year building them from scratch or ship them next quarter with an embedded analytics platform designed for exactly this use case.
Modern logistics platforms can’t afford to spend a year building dashboards while competitors ship features faster. This is where Luzmo comes in.
Luzmo is purpose-built for SaaS companies that need to deliver customer-facing analytics directly inside their products—without building and maintaining a full analytics infrastructure themselves. Instead of assembling visualization layers, multi-tenant permissions, query engines, and AI analytics from scratch, product teams can embed production-ready dashboards and data experiences in weeks.
Here’s what that means in practice for logistics platforms.
Luzmo provides an API-first embedded analytics platform that integrates directly into SaaS products. Teams can connect their existing data sources, design dashboards with a drag-and-drop builder, and embed them using SDKs for modern frameworks like React, Vue, and Angular.
Instead of spending 6–12 months building tracking dashboards and analytics infrastructure, logistics platforms can ship features like:
This dramatically reduces time-to-market while freeing engineering teams to focus on core logistics innovation.
Supply chain platforms serve multiple stakeholders—shippers, carriers, 3PLs, and freight brokers—all needing access to their own data.
Luzmo handles this complexity with built-in multi-tenancy and row-level security, ensuring every customer only sees their own shipments, routes, and performance metrics.
The same dashboard templates can automatically adapt across hundreds of customers, making it easy to scale your platform without rebuilding analytics for every account.
Logistics analytics often require real-time or near real-time updates—shipment status, warehouse activity, or delivery exceptions.
Luzmo’s Warp data acceleration layer optimizes queries and ensures dashboards remain fast even as data volumes and usage grow.
That means customers can refresh shipment data instantly instead of waiting for slow queries or batch updates.
Beyond dashboards, Luzmo also enables AI-driven data exploration with Luzmo IQ.
With natural language querying, users can simply ask questions like:
Luzmo IQ interprets the question and returns instant insights with charts and explanations, allowing non-technical users to explore data without building reports.
This democratizes data across logistics teams—from operations managers to customer success teams.
The biggest advantage of embedded analytics is strategic.
Instead of sending customers to external BI tools or carrier tracking pages, Luzmo allows you to deliver fully white-labeled dashboards that look and feel native to your product.
That means:
Supply chain visibility is quickly becoming a baseline expectation. Platforms that provide real-time tracking, operational insights, and self-service analytics will win the next generation of logistics software.
Luzmo helps teams deliver those capabilities faster—without the engineering burden of building analytics infrastructure from scratch.
Instead of spending a year building dashboards, you can focus on what actually differentiates your logistics platform.
Better routing. Smarter automation. Stronger customer relationships.
And the analytics layer that powers it all?
That’s where Luzmo fits in. Try it today.

All your questions answered.
Build your first embedded data product now. Talk to our product experts for a guided demo or get your hands dirty with a free 10-day trial.


