Productizing Analytics: A Customer-Facing Maturity Model
78% of SaaS companies have dashboards, but only 12% actually monetize analytics as product features. The other 66%? They're stuck in a weird middle ground—pouring engineering resources into analytics that customers tolerate but don't pay for.
If you're a CPO, VP Product, or Product Manager at a data-centric SaaS company—where analytics isn't just back-office reporting but core product value—you're feeling dual pressure right now. You need to deliver measurable customer value while justifying every sprint your team spends on analytics features. Your internal BI stack solves the wrong problem entirely. Customer-facing analytics doesn't live in Looker or Tableau. It lives in your product UX, in the workflows your customers use every single day.
This maturity model shows your fastest path from basic dashboards to productized insights that actually drive ARR. And if you're operating in US, Canada, UK, Ireland, France, Belgium, or Netherlands markets, the roadmap we're about to walk through maps directly to what product-led SaaS companies are shipping right now.
First, let's get brutally clear about what customer-facing analytics actually means for your roadmap—because the definition matters more than you think.
Customer-Facing Analytics Defined (And Why Your BI Team Doesn't Own This)
Customer-facing analytics is not internal BI wearing a customer hat. The distinction isn't semantic—it's structural, and it determines who owns the roadmap and what success looks like.
Here's the breakdown:
Customer-Facing Analytics ≠ Internal BI
- Lives in customer product journey (not separate login)
- Self-serve by non-technical users (not analyst-dependent)
- Drives retention/expansion revenue (not operational efficiency)
- Owned by Product team (not Analytics/BI team)
When you get this right, the business outcomes are measurable and significant. Companies with embedded analytics see +34% product adoption compared to those without. When customers can access insights directly in your product, churn drops by an average of 27%. And if you tier your analytics features properly, you're looking at +19% net revenue retention from analytics upsells alone.
But here's the catch: not all customer-facing analytics deliver these outcomes. A dashboard iframe that loads slowly and shows generic KPIs won't move your retention numbers. The maturity level of your analytics implementation determines whether you see ROI or just accumulate technical debt.
Your position on this maturity curve matters because it tells you exactly what to build next—and what revenue you're leaving on the table right now.
The Maturity Model: 5 Levels from Static Exports to Revenue Engine
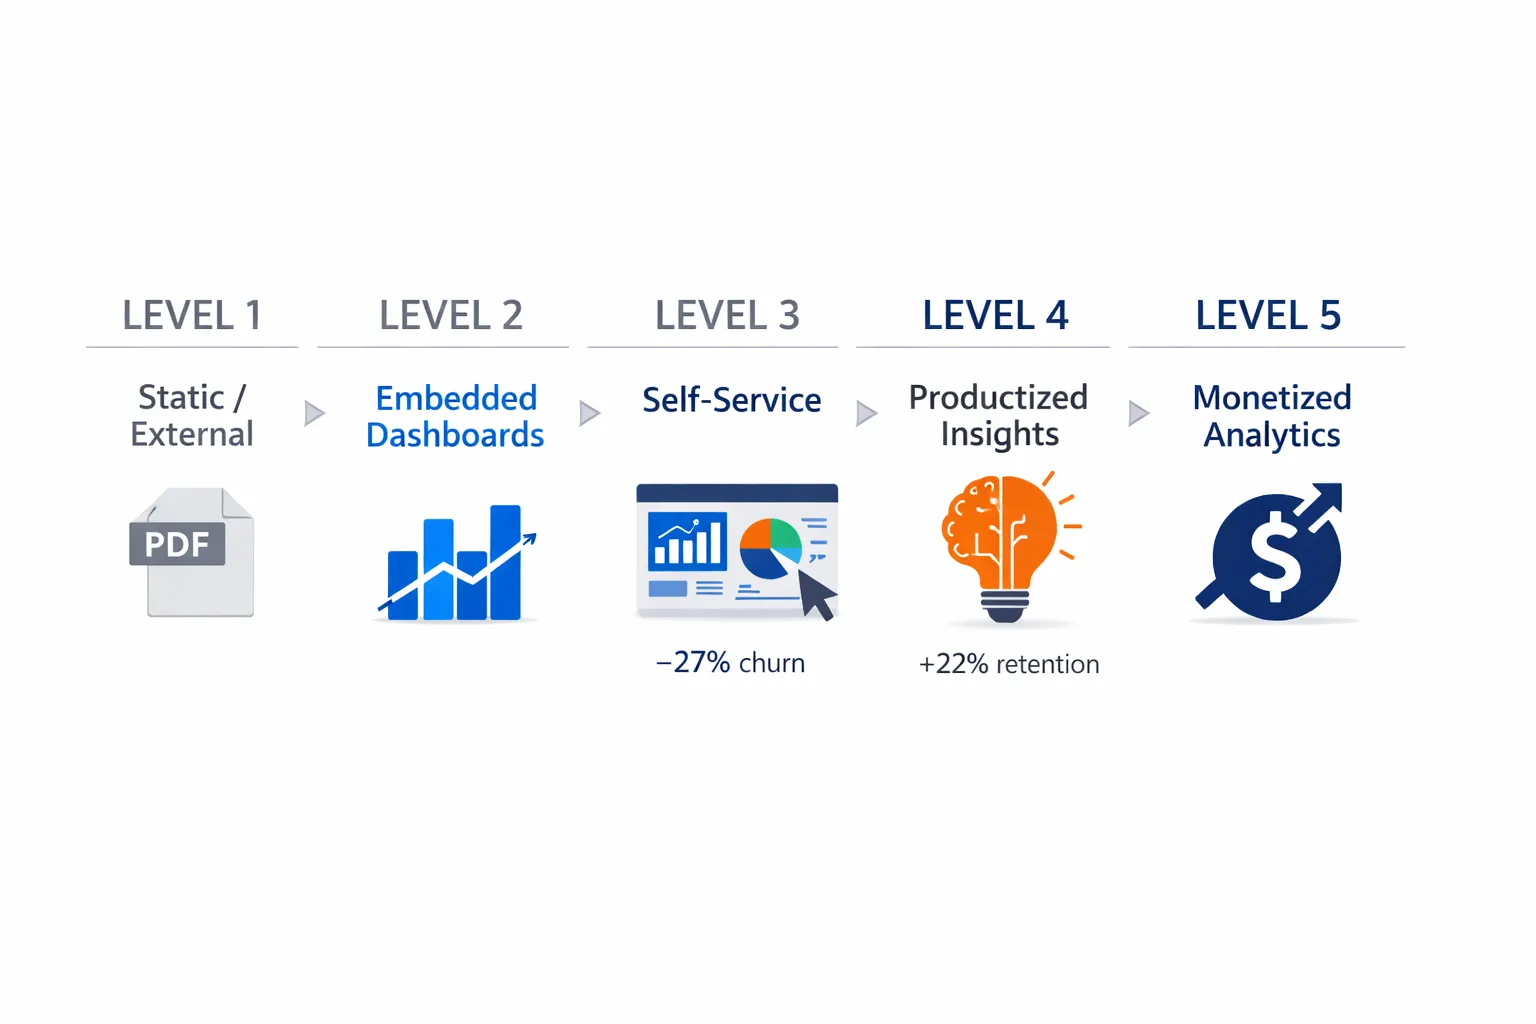
Level 1: Static/External
What it looks like: You're emailing PDF reports weekly. Your customers are downloading CSV exports from your admin panel. Some are getting Looker Studio links. A few power users have built their own Google Sheets connected to your API.
What users can answer: "What happened last week?" But they can't act on it in context. They have to copy data, switch tools, and manually create their own analysis.
The sales problem: If this is you, you're not ready for embedded analytics yet. You need to solve basic data access first. But here's the painful part—your best customers are already building their own dashboards because you haven't given them a better option. That means you've lost control of the experience, the branding, and any chance of monetization.
The product reality: This is a sales disqualifier for sophisticated buyers. When prospects evaluate your platform and see "contact us for reports," they're comparing you to competitors who have self-service analytics baked into the product UX.
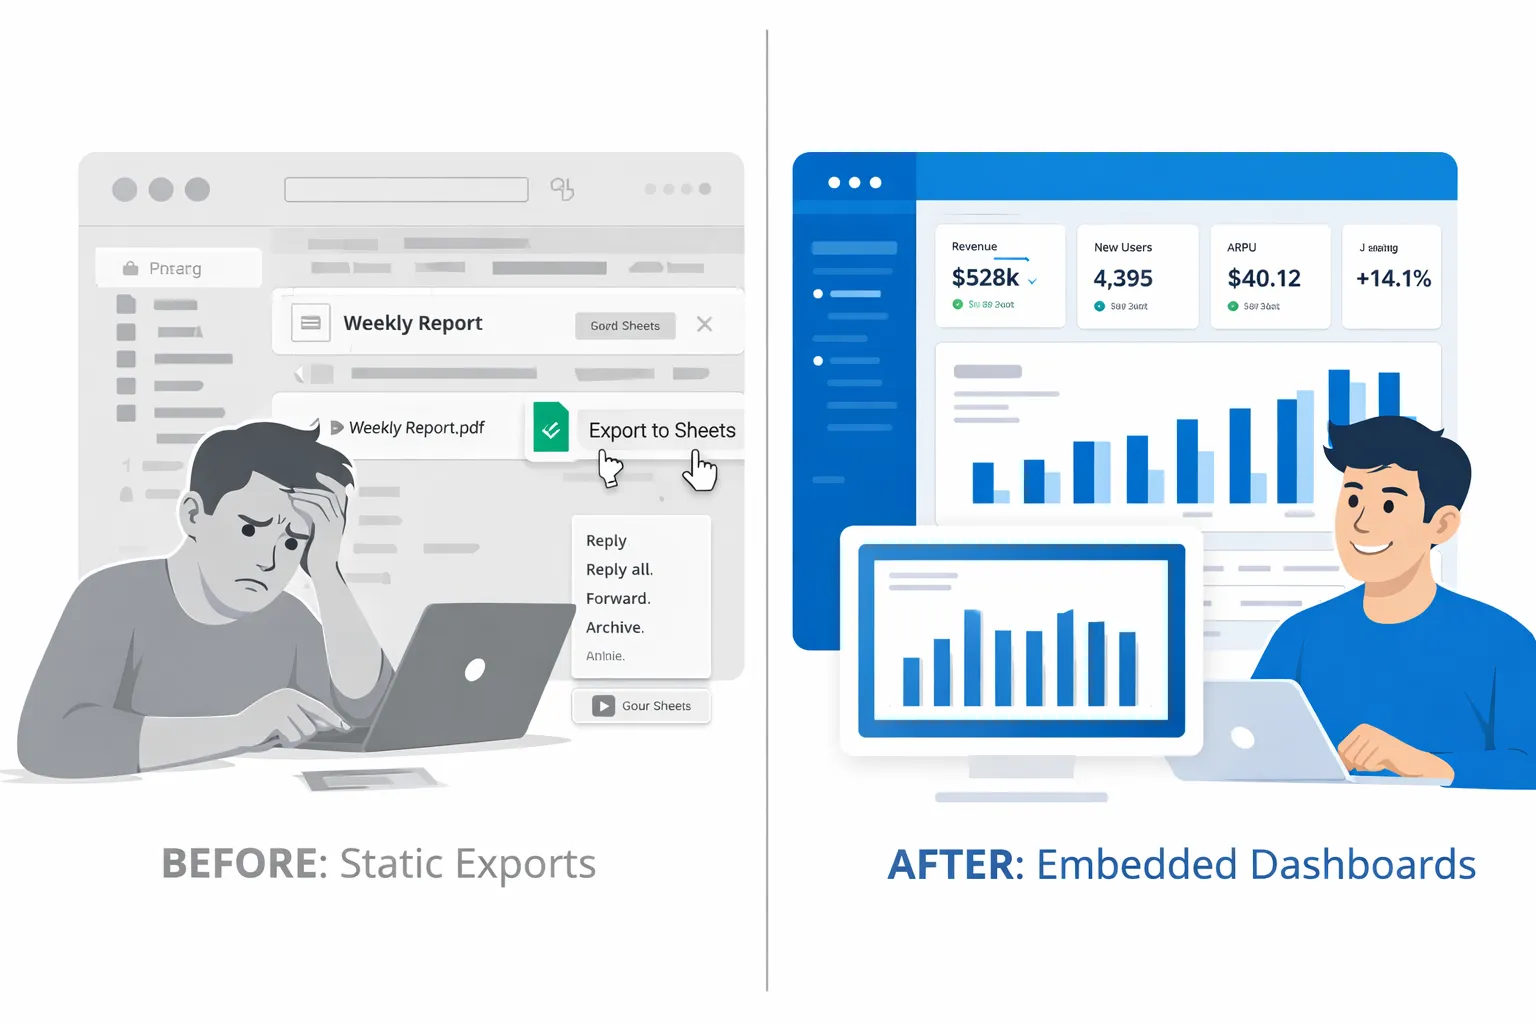
Level 2: Embedded Dashboards
What you have:
- Charts and tables embedded via iframe
- Basic filtering and date range controls
- Download and refresh capabilities
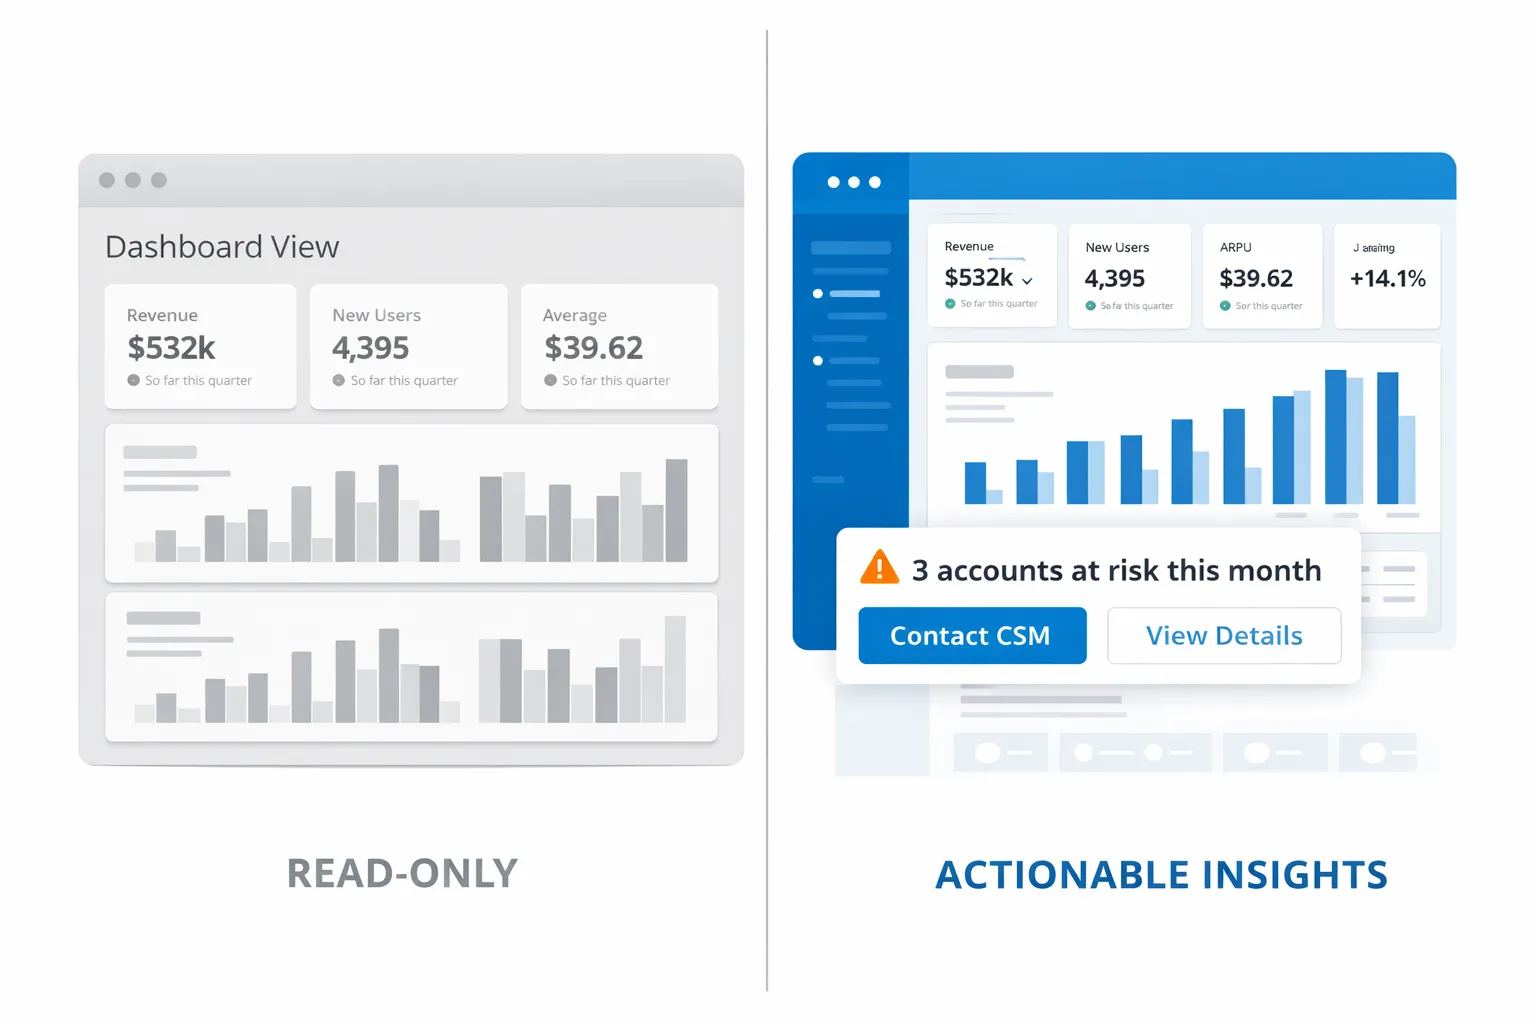
- Read-only views of pre-built KPIs
What users can do: They can view data in your product instead of leaving. They can filter by date, region, or whatever dimensions you've pre-configured. They feel like they're getting "analytics" without leaving your interface.
The biggest limitation: It's completely read-only and generic. Every customer sees the same dashboard template. If a user wants a custom view or a metric you didn't think of, they're filing a feature request or—more likely—exporting to Excel again.
Luzmo Studio value: This is where you can move fast. With a no-code dashboard builder, you go from concept to production-ready embed in days, not quarters. You're not building custom BI infrastructure—you're configuring dashboards with drag-and-drop and embedding them with a few lines of code.
Real-world pace: Companies using Luzmo Studio regularly go from Google Sheets exports to Level 2 embedded dashboards in two weeks. The key is that you're not owning the entire BI stack—you're leveraging a white-label platform that looks native to your product from day one.
Level 3: Self-Service Analytics
What changes at Level 3:
New capabilities:
- Users create custom views without filing tickets
- Role-based dashboards (CEO sees different data than CSM)
- Customer-set alerts and notifications on their KPIs
- Multi-tenant data isolation (Customer A can't see Customer B's data)
This is where analytics starts feeling like a real product feature instead of a reporting add-on. Your customer success team stops getting "can you pull this report?" requests because users can answer their own questions. Your engineering team stops getting one-off dashboard requests because the platform supports customization natively.
The Luzmo differentiator: Native multi-tenancy means you're not building complex database partitioning logic. Each customer's data is isolated by default, and you control access at the tenant level through your existing auth system. When a customer connects their own data sources, everything remains scoped to their account automatically.
The transition moment: Level 3 feels advanced—until your power users start asking "okay, but what should I DO with this data?" That question means you're ready for Level 4.
Level 4: Productized Insights
This is the game-changer level. You stop showing data and start driving actions.
What productized insights look like:
Workflow nudges: "You have 3 accounts at risk of churning this month—here's the specific action to take for each one."
AI recommendations: "Based on your pricing data and customer behavior, try pricing change X with segment Y."
Contextual benchmarking: "Your churn rate is 4.2% vs 6.1% industry average for companies your size. Here's why you're outperforming."
Automated actions surface-to-surface: Insights don't live in a separate analytics tab—they appear exactly where users are working. A sales rep sees "this deal is 73% likely to close" directly in the deal view. A marketer sees "this campaign segment is underperforming—try these 2 adjustments" in the campaign builder.
Why this drives retention: Because you're not making customers figure out what the data means. You're telling them what to do next, backed by their actual data and your product intelligence. This is where analytics becomes a competitive moat instead of table stakes.
Luzmo IQ + Flex: The Flex SDK lets you embed insights in your native workflows, not just in dashboard pages. IQ adds AI-powered recommendations that feel like they're coming from your product, not a third-party analytics tool. It's white-labeled intelligence that drives user actions.
ROI example: One Luzmo customer (SaaS platform in the customer success space) added churn prediction tiles directly in their account health views. Result: +22% retention improvement in the first quarter because CSMs were taking action on at-risk accounts before they churned, not after.
Level 5: Monetized Analytics
At Level 5, analytics isn't a feature—it's a revenue line item.
What monetization looks like:
Premium tiers: "Advanced Insights" plan at +$50/month per seat unlocks predictive analytics, custom reporting, and API access to raw data.
Partner dashboards: Your resellers and channel partners get white-labeled analytics portals they can brand and sell to their customers.
Data-as-a-service: You package your aggregated, anonymized insights and sell them as an API product. Think "industry benchmark data" or "market intelligence feeds."
White-label analytics products: You spin up entirely separate analytics products under your customers' brands, and they resell them to their end users.
The Luzmo complete stack: White-label branding, billing isolation per tenant, usage analytics to support value-based pricing, and the infrastructure to support thousands of embedded instances without your engineering team managing servers.
Time to value: Most companies don't jump straight to Level 5. You build to Level 3, validate customer willingness to pay for analytics, then architect Level 5 features. With the right platform, you're looking at 12 weeks to launch monetized tiers—not 12 months of custom development.
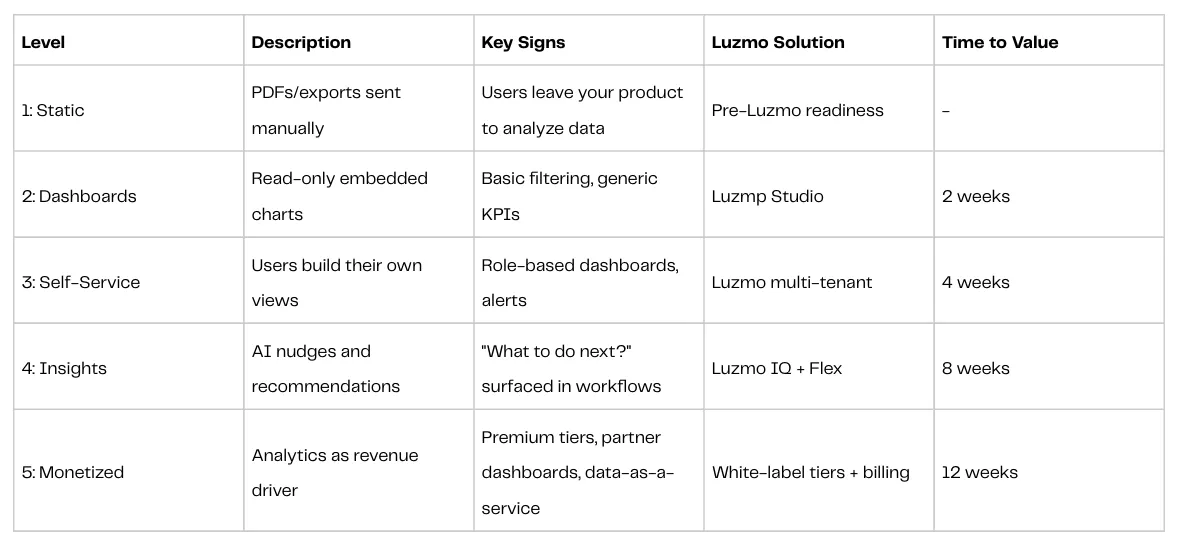
Maturity Model at a Glance
Here's the complete framework in one table (sales teams: screenshot this):
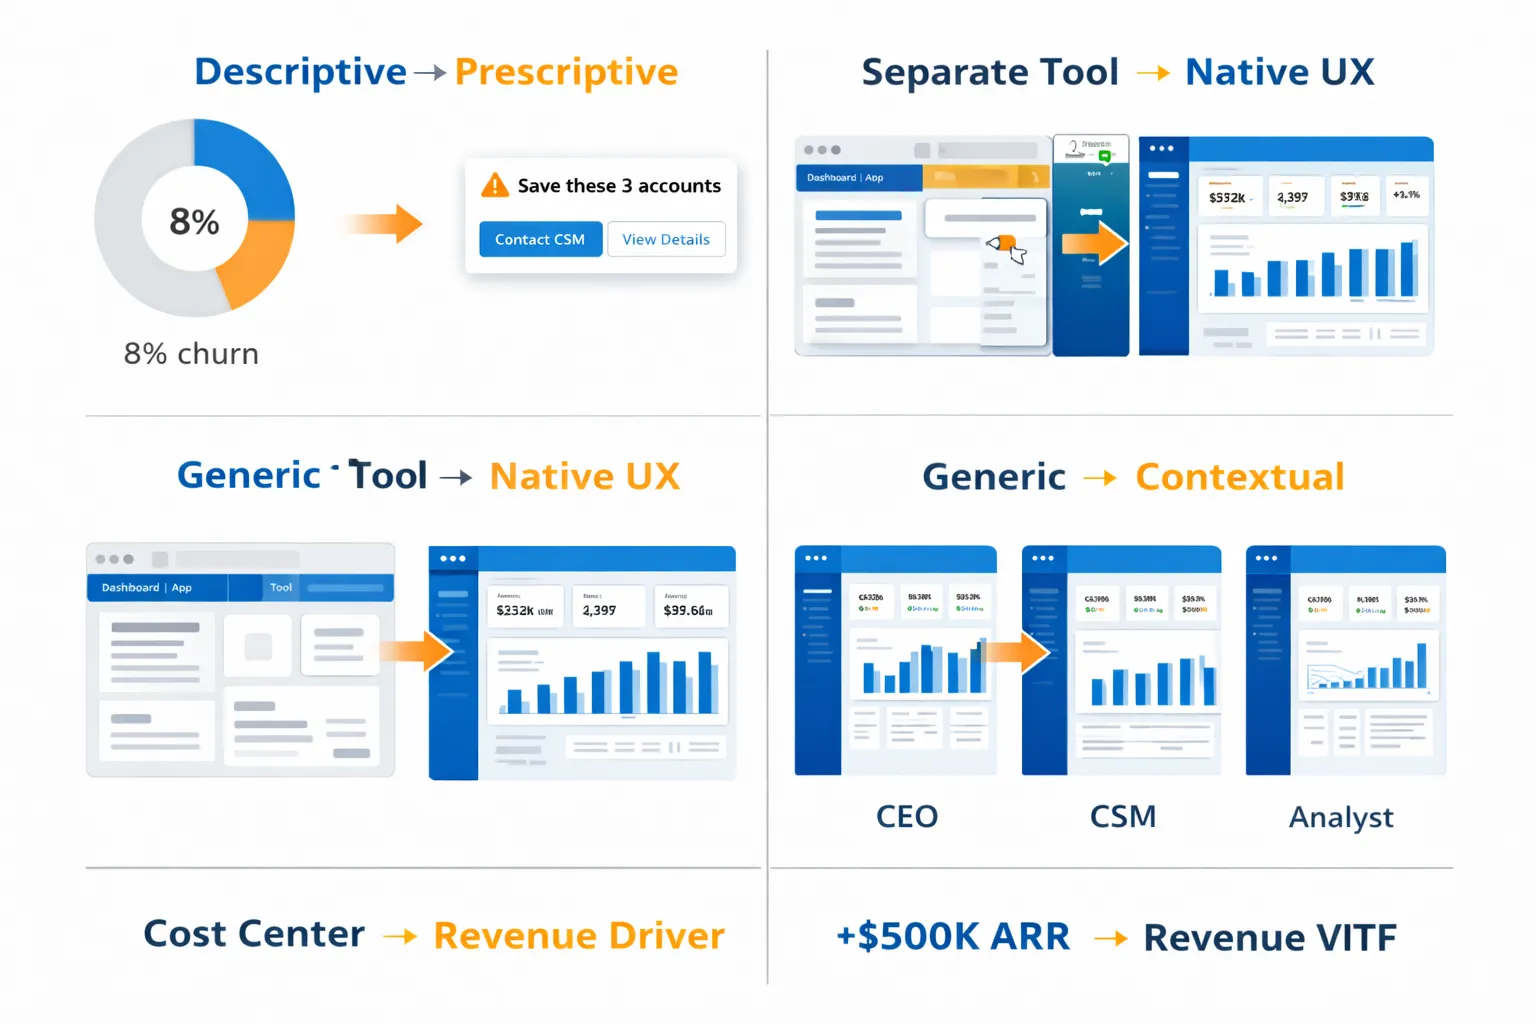
The Four Mindset Shifts to Productized Insights
Moving from Level 2 to Level 4 requires more than adding features. It requires changing how your product team thinks about analytics entirely. Here are the four shifts that separate companies stuck at "dashboards" from those building analytics revenue engines:
1. Descriptive → Prescriptive
Old way: "Your churn rate is 8% this quarter."
New way: "You're about to lose these 3 accounts—here are the 2 specific actions to save each one, ranked by likelihood of success."
Descriptive analytics tells users what happened. Prescriptive analytics tells them what to do about it. The difference is that prescriptive analytics requires you to embed domain expertise into your product. You can't just expose data—you need to know what good performance looks like in your customers' context and guide them toward it.
This is why generic BI tools don't work for customer-facing analytics. Tableau doesn't know what "good" looks like for your customers. Your product does.
2. Separate Tool → Native UX
Old way: "Click here to view analytics" (opens separate BI portal, separate login, separate navigation).
New way: Dashboard tiles, insight cards, and recommendations appear exactly where users are already working—no context switching required.
The moment you make a user leave their workflow to "go check analytics," you've lost. Adoption drops. Engagement drops. The analytics become an afterthought instead of a driver of daily behavior.
Native UX means analytics feels like a natural part of your product, not a bolt-on BI tool. That requires an SDK-level integration, not just an iframe embed.
3. Generic → Contextual
Old way: Show company-wide averages. Every customer sees the same benchmarks.
New way: "Your conversion rate is 12.3%, which is 40% higher than companies in your industry and revenue range. Here's why."
Contextual analytics requires you to know something about each customer—their industry, size, maturity, goals—and tailor insights accordingly. This is where role-based dashboards and customer segmentation become product requirements, not nice-to-haves.
When a CEO logs in, they should see high-level health metrics and board-ready charts. When a CSM logs in, they should see account-level details and action items. Same data, completely different presentation.
4. Cost Center → Revenue Driver
Old way: Analytics is a $50K engineering project that customers expect for free.
New way: Analytics is a $500K ARR line item, with premium tiers, upsell paths, and expansion revenue built into the pricing model.
This shift requires you to treat analytics like a product, not a feature. That means:
- User research on what insights customers will pay for
- Tiered feature sets with clear value differentiation
- Pricing tied to value delivered (seats, data volume, advanced features)
- Go-to-market messaging that positions analytics as a competitive advantage
The proof that this works: Luzmo's internal data shows companies using their platform reduce custom BI engineering by 90% while launching embedded analytics in weeks instead of quarters. You're not building a cost center—you're enabling a revenue stream your team can iterate on without rewriting the entire stack.
Self-Assessment: Where Does Your Product Sit?
Let's make this concrete. Take 60 seconds and answer these questions. By the end, you'll know exactly which maturity level you're at and what to build next.
ICP + Maturity Quiz
PRODUCT FIT
- ☐ Analytics is core product value (not just internal BI for back-office reporting)
- ☐ You sell recurring B2B subscriptions (MRR/ARR business model)
- ☐ You operate primarily in US, Canada, UK, Ireland, France, Belgium, or Netherlands
MATURITY SIGNALS
- ☐ Users can access analytics inside your product today (not via email reports) → Level 2+
- ☐ Customers can create their own custom dashboard views without engineering help → Level 3+
- ☐ You need to show "what to do next" recommendations, not just historical data → Level 4+
- ☐ You're planning analytics premium tiers or partner/reseller dashboards → Level 5
BLOCKERS
- ☐ Biggest issue is time-to-market (need to ship embedded analytics fast)
- ☐ Biggest issue is customization needs (require pixel-perfect control and white-label)
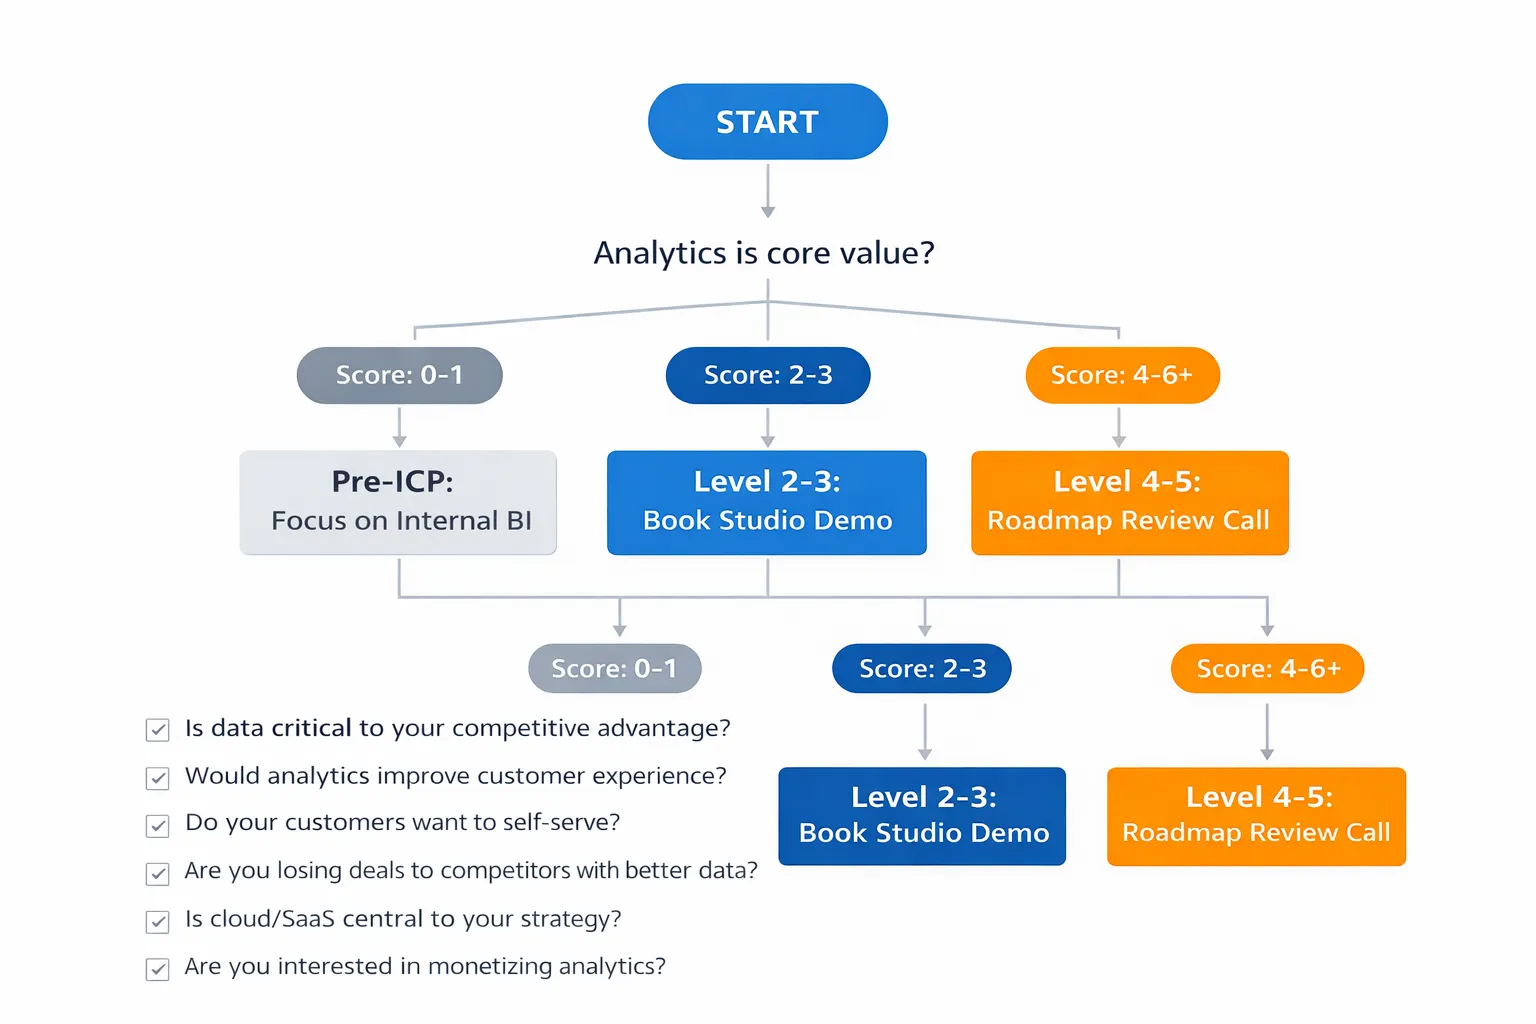
Scoring + Next Step
4-6 Yes = Level 3+ ICP → You're ready for productized insights. Book a roadmap review call to map your path to Level 4-5.
2-3 Yes = Level 2 ICP → You're at embedded dashboards and ready to add self-service. Start with a Luzmo Studio demo to see how fast you can launch.
0-1 Yes = Pre-ICP → You likely need internal BI first. Focus on data infrastructure before customer-facing analytics.
Signs You're at Each Level
Level 1-2 signals:
- "Our customers export data to spreadsheets regularly."
- "Analytics live outside our core product experience."
- "We email PDF reports or give users links to external BI tools."
Level 3 signals:
- "Users can build their own views and save custom dashboards inside our app."
- "We have role-based access—different personas see different data."
- "Customers set their own alerts and get notified when KPIs change."
Level 4-5 readiness:
- "We want analytics to drive product-led growth and expansion revenue."
- "We're considering premium analytics tiers or selling analytics to partners."
- "We need to embed recommendations and next-best-actions in customer workflows."
If you're stuck between Level 2 and 3—you have dashboards but users can't customize them—that's the most common place product teams get trapped. You've invested in embedded analytics but haven't unlocked self-service, which means every dashboard request still hits your backlog.
The path forward is clearer than you think. Let's look at how embedded analytics platforms accelerate each stage.
For Product Leaders: Why Embedded Analytics Platforms Exist
FOR CPOS, VP PRODUCT, AND HEADS OF PRODUCT AT DATA-CENTRIC SAAS COMPANIES
Here's what you should care about when evaluating whether to build or buy your customer-facing analytics stack:
✅ Launch embedded analytics in WEEKS, not quarters. Your engineering team has a roadmap. Custom BI infrastructure will consume 6-12 months and ongoing maintenance. Embedded platforms get you to production in 2-8 weeks depending on complexity.
✅ HIGH CUSTOMIZATION without high maintenance. You need pixel-perfect white-labeling and full control over UX. But you don't want to own the BI stack. Modern embedded platforms give you no-code Studio tools for speed and full SDK (Flex) for custom integrations—same platform, different entry points.
✅ Avoid BI stack ownership. Multi-tenancy, data isolation, caching, query optimization, security, uptime SLAs—these are all solved problems. You want to focus on your core product differentiation, not debugging database performance for analytics queries.
✅ Multi-tenant, white-label, production-ready Day 1. You're not launching a beta analytics feature. You're embedding a production-grade capability that scales with your customer base. That means tenant isolation, SSO, role-based access, and branding that looks native to your product—out of the box.
Next step: Book a 30-minute roadmap review. We'll assess your current maturity level, map your path to monetization, and show you exactly what's possible in your first 90 days.
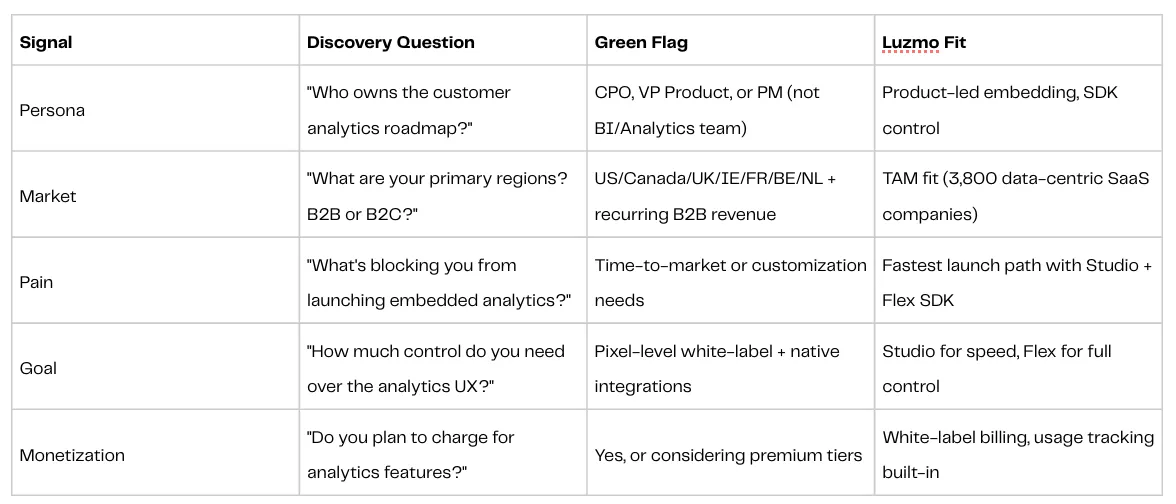
Sales Qualification Framework: ICP Matrix
If you're on the sales or partnerships side, here's how to qualify opportunities using this maturity model.
Disqualifiers:
- Internal BI use case (not customer-facing)
- B2C with millions of end users (pricing model doesn't fit)
- Regions outside target markets (support/compliance complexity)
- "We want to build this ourselves" + 3-month timeline (unrealistic without platform)
How Luzmo Accelerates Your Maturity Journey
Different maturity levels require different tools.
Here's how Luzmo's product stack maps to where you are and where you're going:
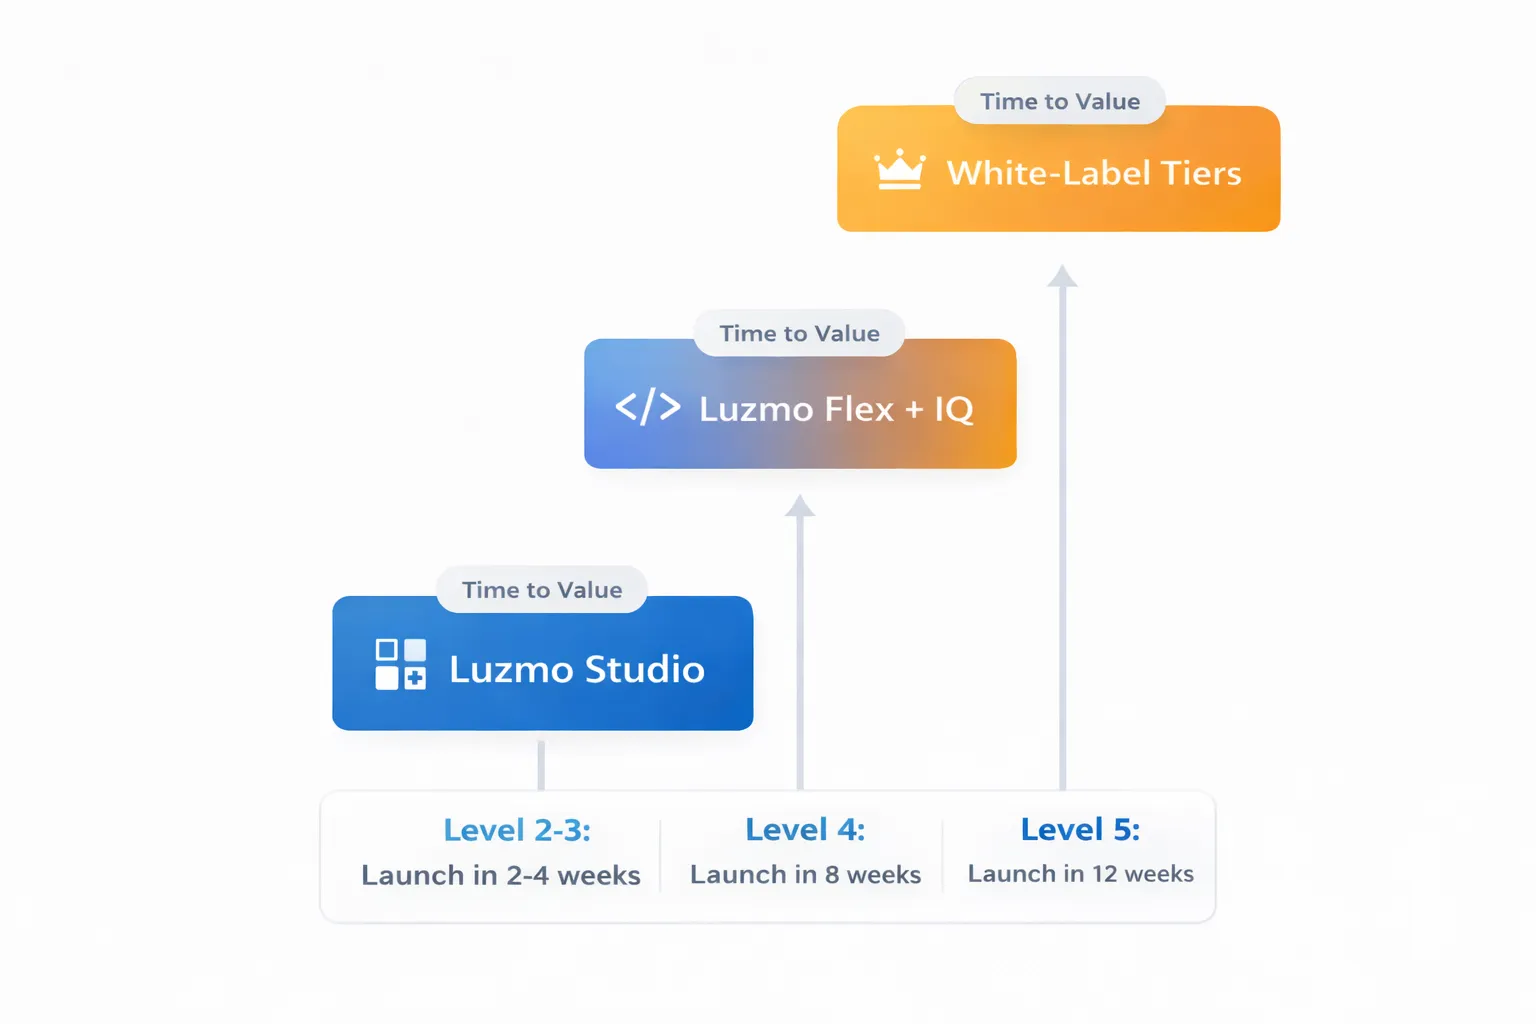
LEVEL 2-3 → Luzmo Studio (Launch in Days)
What you get:
- No-code dashboard builder (drag-and-drop, not developer-dependent)
- Production-ready iframe embeds with white-label branding
- Multi-tenant data isolation built-in (no custom database logic)
Time to value: 2 weeks to launch embedded dashboards. 4 weeks to add self-service customization for end users.
Best for: Teams that need to ship embedded analytics fast without engineering bottlenecks.
LEVEL 4 → Luzmo Flex + IQ (Launch in Weeks)
What you get:
- SDK embeds in native workflows (not separate analytics tabs)
- AI-powered insights like "3 accounts at risk—here's what to do"
- Customer benchmarking and contextual recommendations
Time to value: 8 weeks to launch productized insights that drive user actions.
Best for: Product teams ready to move beyond dashboards and embed intelligence directly into customer workflows.
LEVEL 5 → White-Label Tiers (Launch in Months)
What you get:
- Branded analytics products you can sell as standalone offerings
- Billing isolation and usage tracking to support value-based pricing
- Partner dashboards with reseller/white-label capabilities
Time to value: 12 weeks to launch monetized analytics tiers.
Best for: Companies treating analytics as a revenue engine, not just a product feature.
Next Step by Maturity Level
Level 2-3 (Embedded Dashboards + Self-Service): You need to launch fast and iterate based on customer feedback. → [Book a Luzmo Studio Demo]
Level 4 (Productized Insights): You're ready to embed AI-powered recommendations in customer workflows. → [Luzmo IQ Technical Review]
Level 5 (Monetization Strategy): You want to build analytics into your pricing and GTM strategy. → [Monetization Strategy Call]
Not sure where you are? Take 90 seconds for our maturity assessment and get a custom 90-day roadmap. → [Maturity Assessment Form]
Over to you
Most SaaS companies build dashboards. Few build productized insights. Even fewer monetize analytics as a revenue driver.
The difference isn't technical capability—it's strategic clarity about which maturity level you're at, what you need to build next, and how fast you can ship it without accumulating technical debt.
If analytics is core to your product value (not just back-office reporting), and you're selling to B2B customers in target markets, this maturity model is your roadmap. The companies winning with embedded analytics aren't building custom BI stacks from scratch. They're using platforms that let them move fast, iterate based on customer feedback, and scale without owning the infrastructure.
Where you are today matters less than how fast you can move to the next level. The question isn't whether to embed analytics—it's how quickly you can turn analytics into a competitive moat and a revenue engine.
Your move.
Written by

Ship the future of your data
Let us show you what Luzmo can do for your product.

Leave your e-mail and one of our analytics experts will reach out to you