Power BI vs ThoughtSpot BI Tool: The 2026 Comparison

Business intelligence tools are one of the most important assets for data-driven companies in 2026. Whether you want to build dashboards internally or create different visualization types for your business users, having them in your tool stack can bring a positive ROI for your business.
But how do you choose the right tool for the job? ThoughtSpot and Microsoft’s Power BI are two great choices. One is a new-ish AI-powered app with self-service features (ThoughtSpot) while the other is more geared towards internal reporting (PBI).
Let’s see which one of the two comes out on top.
Power BI vs ThoughtSpot: the ease of use
When talking about the ease of use for any analytics platform, we have to consider two sides of the story: how easy it is to use for your internal team and your end-users accessing your dashboards and reports.
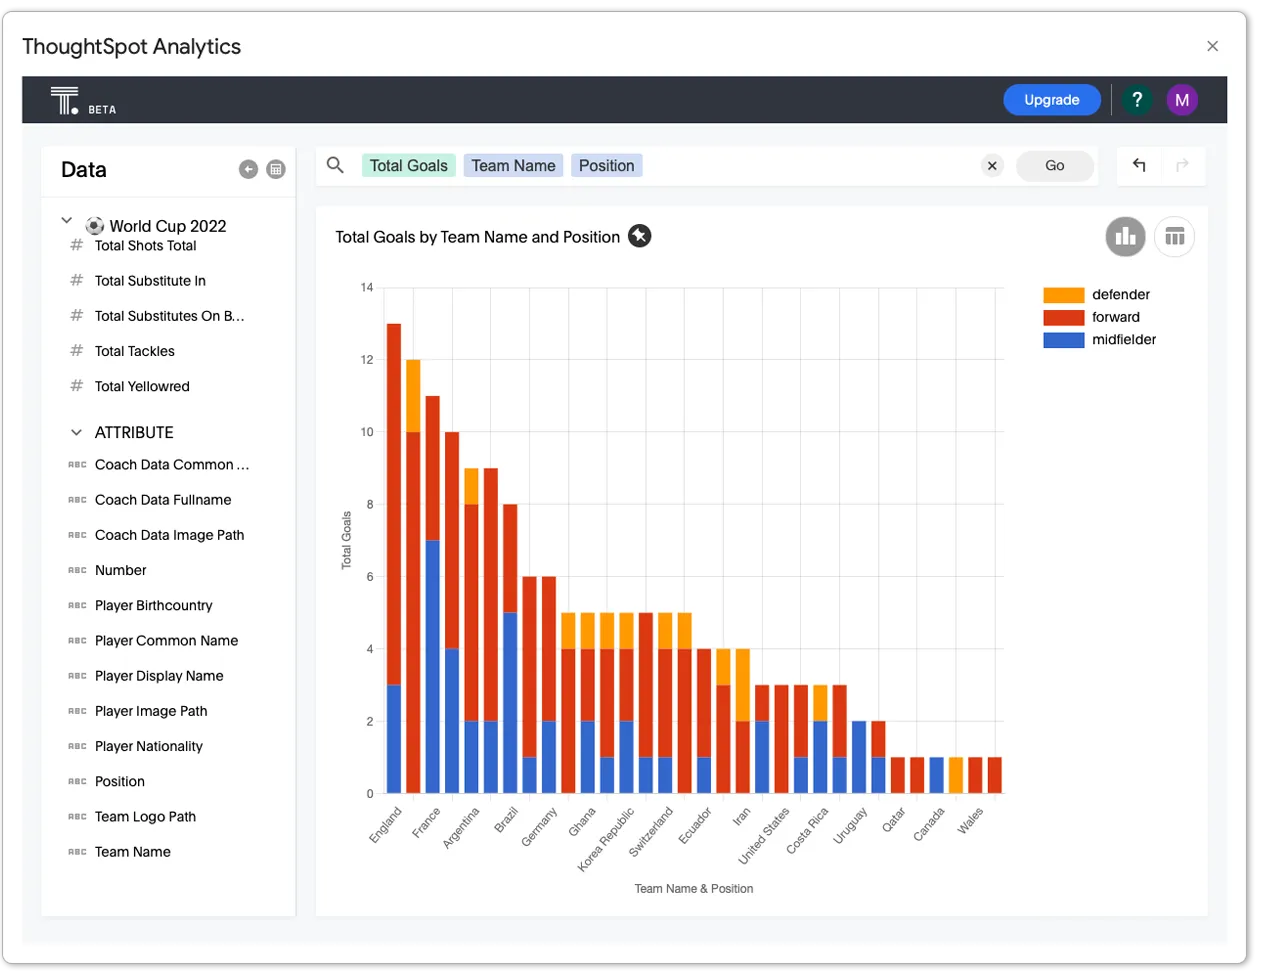
ThoughSpot is built with connectivity in mind, allowing your internal team to use natural language processing and machine learning to ask questions about your data. In theory, it works like a Google of sorts. You have a database and you ask it questions in plain English, without requiring the knowledge of SQL, Python, or similar languages.
In practice, it’s more complex than that, and for this feature to work, you have to lay significant groundwork ahead, for someone to be able to do these searches and e.g. do data forecasting based on historical data. If you already have a team of data analysts on board, ThoughtSpot does not have a bad learning curve.
On the other hand, working with Power BI is like using Excel on steroids. And if like the author of this blog, your Excel skills are pretty poor, this means plenty of learning. Companies already deep in the Microsoft network of products are going to have an easier time creating dashboards and reports in Power BI.
However, enterprise teams commonly have a number of Power BI specialists who work just in this tool - which is what we recommend having if you’re implementing the tool across your organization. You’re going to need the knowledge of a language called DAX (data analytics expressions) and there are developers specializing in just this.
Neither tool is phenomenal in terms of ease of use for business users who view and edit dashboards while they are embedded. ThoughtSpot does not have many features for data exploration, and when trying to do this, dashboards are often glitchy and unresponsive.
For Power BI, the end user can expect issues with data performance. The bigger your databases, the slower the dashboards will load. Setting permissions for different user groups can also be pretty complicated.
PS. for more details on ease of use and features, check out our full ThoughtSpot review.
The visualizations
After cleaning and data modeling, your data should be turned into engaging visuals for all the relevant stakeholders to understand. So, instead of tables and rows of data, you get beautiful graphs and charts that show changes in data and can be shared easily.

In this battle, ThoughtSpot is the obvious loser. According to a number of user reviews, the choice of visualizations is rather limited. Also, they don’t look the best compared to industry leaders like Power BI, Tableau, Qlik, Looker and other ThoughtSpot competitors.
Power BI reigns supreme in the visualization department. You get a wide choice of graphs, charts, heatmaps, pivot tables, and more. Users can interact with these to view the data they need, both internally and in embedded dashboards.
Data sources
Whether you need internal reporting or embedded dashboards, having access to a wide variety of data sources is important. Your developers can have an easier time connecting datasets to dashboards and typically, you can go to market with less work and less time spent on building complex integrations.
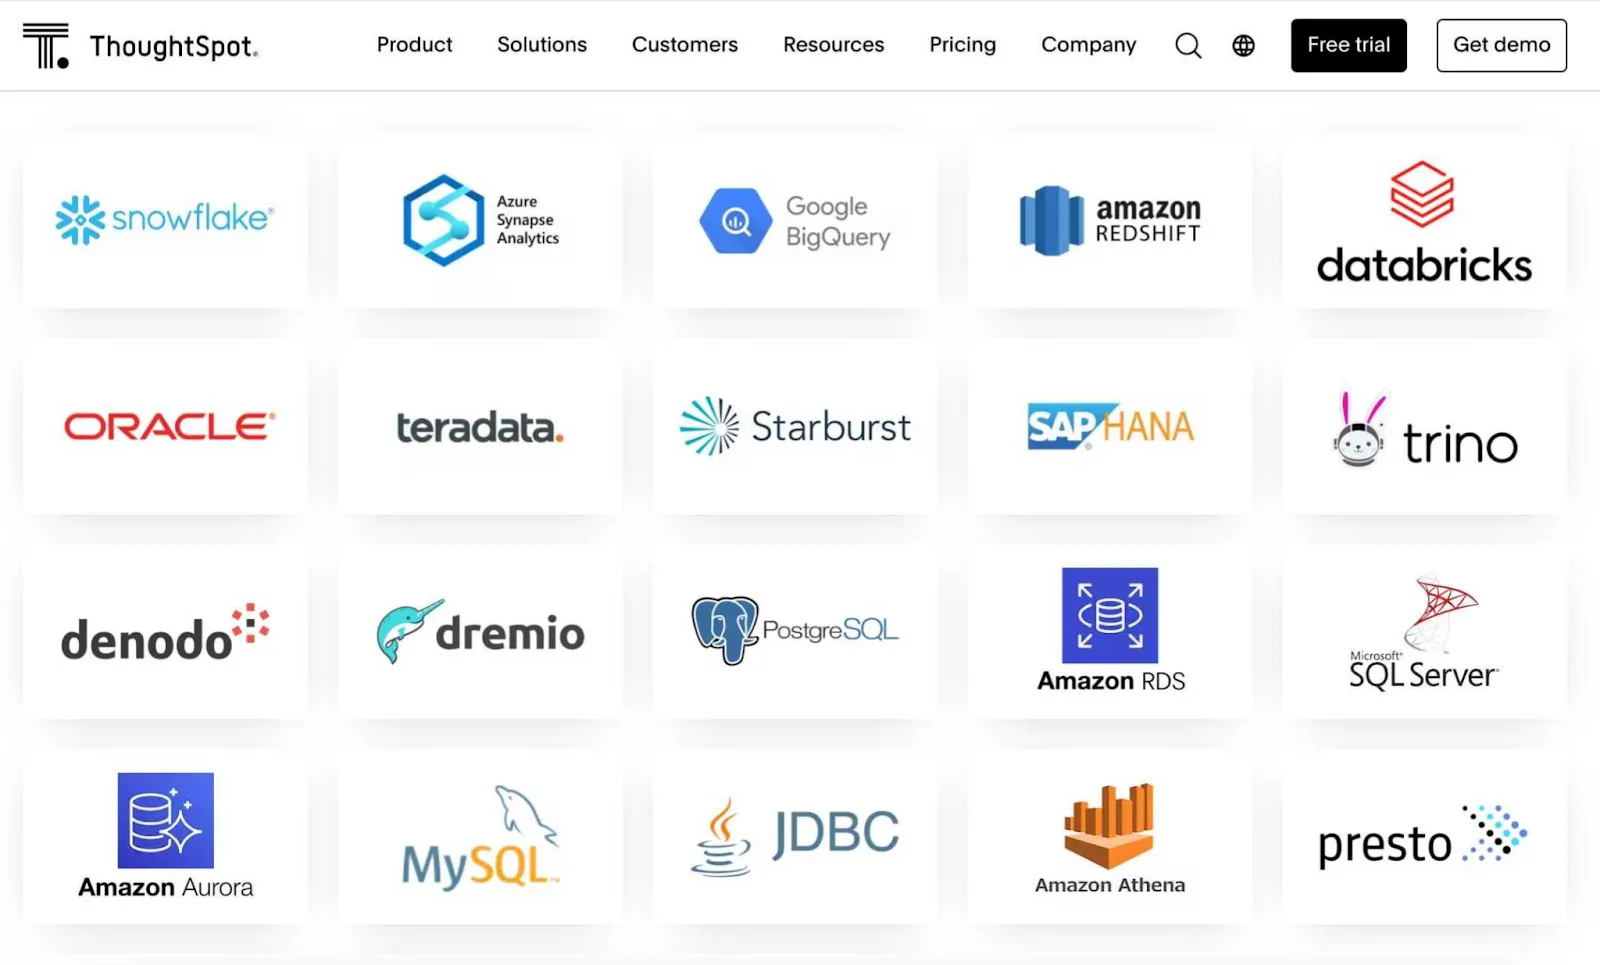
ThoughtSpot is rich in integrations: Snowflake, Azure Synapse Analytics, Google BigQuery, Amazon Redshift, Databricks, Oracle, MySQL, as well as a range of ETL and ELT tools.
Power BI comes with connections to proprietary Microsoft tools: Excel, CSV, JSON, data folders, PDFs and Sharepoint folders. There are plenty of connectors available, to platforms like Azure, Salesforce, Databricks, and others.
If connectors are a concern for your business mode, ThoughtSpot might be the better choice because of the huge variety. Meanwhile, Power BI is better for those who rely on Microsoft apps in their business operations and need them as data sources.
ThoughtSpot vs. Microsoft Power BI - embedding
If you want to create dashboards and embed them in your app, this functionality works pretty well in ThoughtSpot. Embedding is a matter of copying and pasting a few lines of code and you get data analytics features in your SaaS app.
As for the end-users, the experience is not that great. The data visualization options are rather limited and the user experience for self-service analytics is pretty poor. There is not much exploration that can be done in real-time and it’s better for situations where the end-user just views the dashboard.
With Power BI, creating dashboards is a complication in itself. Embedding them is as easy as copying and pasting some HTML code in the appropriate place on your website or app.
But if you want to customize your dashboard or add different types of personalizations, custom levels of access, authentication or data security… You’re going to need an experienced Power BI developer.
For small businesses, ThoughtSpot is the better choice for embedding because it’s more user-friendly for your dev team. However, neither of the two BI solutions is great for the end-user.
ThoughtSpot vs Power BI - pricing
When comparing BI platforms, pricing may not be the only decision-factor—but it’s absolutely a major one.
ThoughtSpot Pricing
ThoughtSpot now offers entry-level internal-analytics plans starting at around US$25 per user/month (billed annually) for up to 25 million rows of data.
For deeper-scale or embedded-analytics use cases, pricing shifts into consumption-based models (e.g., credits per query) or custom-tier enterprise contracts.
While ThoughtSpot’s published pricing appears transparent, user-reports show that actual contracts often run into the six-figure + annual range, especially when embedding is involved.
Power BI Pricing
Microsoft Power BI’s pricing schedule changed significantly: as of April 1 2025, licenses are set at US $14 per user/month for Pro and US $24 per user/month for Premium Per User (PPU).
For embedded analytics or large-scale deployment, Microsoft is also directing customers to Microsoft Fabric capacity-based licensing: pricing varies by reserved capacity (F-SKUs) and scale.
Because of these updates, many organisations need to re-evaluate their licensing strategy, especially if they were planning growth in 2025+.
Comparison & Take-aways
- ThoughtSpot wins on simplicity of starting tiers: easy to understand base plans with fixed-user-counts.
- Power BI offers strong value for large organisations, especially if they already use Microsoft tools—but its pricing is more complex and recently increased.
- Both tools become unpredictable in cost when embedding dashboards, scaling many users, or consuming large datasets.
- Budgeting should account for actual usage, row-limits (ThoughtSpot), and licence type (Power BI Pro vs PPU vs capacity).
- Ultimately, pricing alone should not determine your choice, but given the magnitude of change in 2025-2026, you’ll want to update your licensing assumptions before committing.
Embed your first dashboard in less than 10 days.
TRY LUZMO FREE
The verdict
Which of the two analytics tools is better? It comes down to your unique needs.
ThoughtSpot is the better choice if you prefer ease of use, natural language processing and machine learning features. It has transparent pricing for internal reporting and it’s pretty easy to determine how much you’re going to pay every month.
Power BI is better if you’re already deep in the Microsoft ecosystem and if you have access to developers and data experts who worked with PBI before. It has a range of advanced analytics features for ad hoc reporting, the data visualization choices are excellent and with the right amount of invested time, it has great usability.
For embedded analytics, neither is the ideal choice because they can be difficult to embed and set permissions for, and customization options are limited. Most importantly, pricing is incredibly difficult to predict for both BI tools.
Create functional embedded dashboards with Luzmo
For internal reporting, Luzmo probably isn’t your first choice. And it shouldn’t be, because it’s not what we do best.
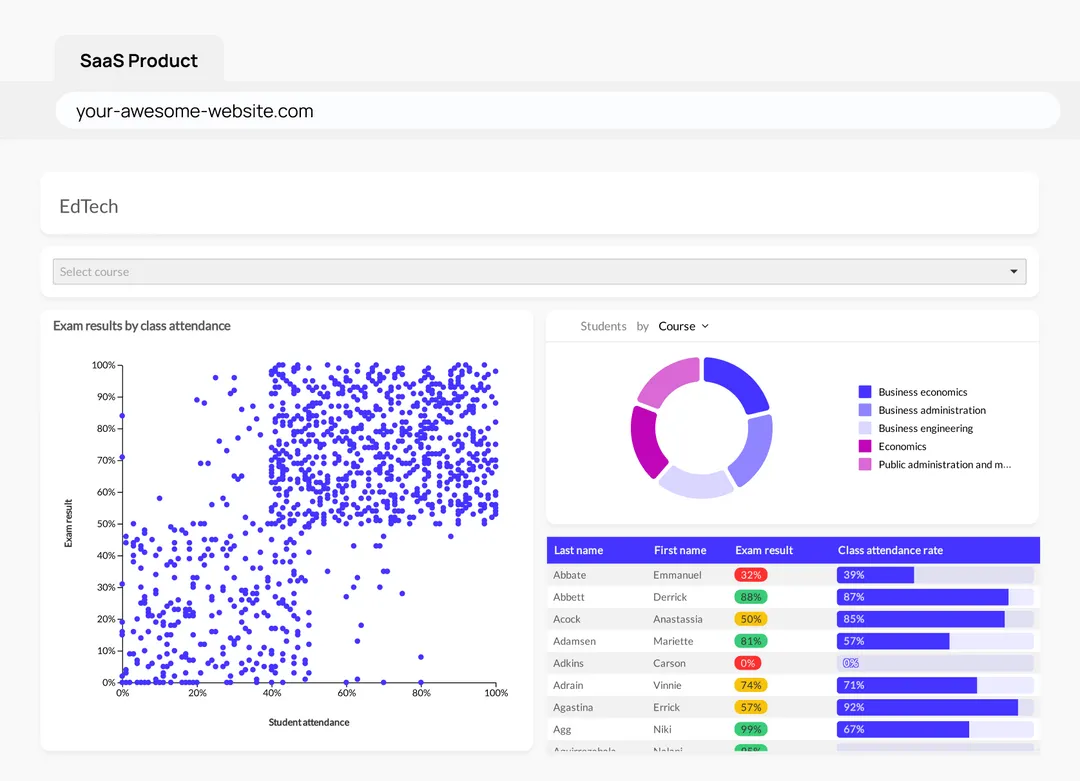
At Luzmo, we focus on helping you build and share amazing embedded dashboards. Connect to your favorite data sources (data warehouse, data lakehouse, CRM, and other apps) with our capable APIs and share your cloud-data in a dashboard.
We’re built for SaaS companies like yours. Embed your dashboard in just a few clicks, and customise it so it fits into your product. Set permissions and authentication rules, and give your business users access to their key metrics in real time.
Here are the core components:
Luzmo Studio: use our drag-and-drop dashboard builder to rapidly design embedded analytics.
Luzmo Flex SDK: give your development team full control over embedding and custom analytics for your product.
Luzmo IQ: add AI-powered insights, natural-language queries and automatic trends for your users.
Agent APIs: trigger in-app actions, integrate dashboards with user behaviour, and build workflow-driven analytics experiences.
And the best part is pricing is not only affordable but also easy to scale and predict on a monthly basis, starting at $495/month for Starter and $1,995/month for Premium, with Enterprise plans available as you grow.
Grab your free trial and start creating functional, beautiful embedded dashboards today!
FAQ
All your questions answered.
What does ThoughtSpot offer in 2025 and beyond?
ThoughtSpot offers an AI-powered BI platform where users can ask questions in natural language and instantly generate interactive dashboards. It supports embedded analytics, large data sets, and usage-based pricing.
How does Power BI compare as a power BI alternative to ThoughtSpot?
Power BI provides a full business intelligence (BI) platform with strong integration in the Microsoft ecosystem, extensive visualizations and data modeling via Power Query. While ThoughtSpot emphasises natural-language search, Power BI excels in data transformation, advanced modeling and creating interactive dashboards for internal teams.
Can Power BI and ThoughtSpot both handle complex data scenarios?
Yes, but differently. ThoughtSpot’s model is suited to search-driven analytics over large volumes with simpler self-service needs. Power BI supports complex data workflows through Power Query for transformation, DAX for modeling and layered dashboards, making it better suited to traditional data graduate and analytics teams.
What role does Power BI’s Power Query play in dashboard creation?
Power BI’s Power Query is the engine for data ingestion, cleaning, shaping and preparing your data before visualizations. It allows users to connect to many sources, apply transformations and build the model that underpins interactive dashboards.
Are both tools capable of generating interactive dashboards?
Yes. ThoughtSpot offers interactive dashboards with embedded search-based analytics; Power BI is well known for its interactive dashboards where users can filter, drill down, slice and view data in real time. Both support dashboard interactivity, but Power BI may offer more flexibility in dashboard design and data exploration.
Which tool is better for embedding analytics in a SaaS product?
If you’re embedding analytics into a customer-facing application and you prioritise search-based insights, ThoughtSpot might be a strong option. If you’re embedding more traditional reporting and visualization with complex modeling and deep integration into your stack, Power BI may offer broader capabilities, but embedding customisation and licensing can be more complex.
How do Power BI vs ThoughtSpot vs Copilot compare for data analysis?
Power BI offers deep modeling and visualization (especially if you’re already in Microsoft’s ecosystem), ThoughtSpot excels at self-service analytics via plain-language search, and Copilot (in Power BI) brings AI assistance - but none replace the need for clean data, well-designed models, and clear governance.
Written by

Ship the future of your data
Let us show you what Luzmo can do for your product.

Leave your e-mail and one of our analytics experts will reach out to you