Embedded Analytics in Business Processes: Top Use Cases
Up until a few years ago, having an embedded dashboard in your SaaS tool meant taking something extremely clunky, like Power BI, and having your developers fight through hours of work to embed it. The end result was a hastily cobbled together dashboard that didn't look like your product and took way too long to load. But thanks to embedded analytics solutions, this is no longer the case.
Within a few hours, you can connect your data sources, create dashboards, and share them so every single SaaS product user can access data visualizations in their account. You may be considering adding embedded analytics tools to your platform to unlock more data insights, but you have no idea which direction to go in first.
Today, we show you some of the best use cases for embedded analytics in business processes so you can get inspired and choose a tool that works for you and your end-users.
What is embedded analytics and how does it work?
Embedded analytics is the integration of data analysis, reporting, and visualization features directly into another software application.
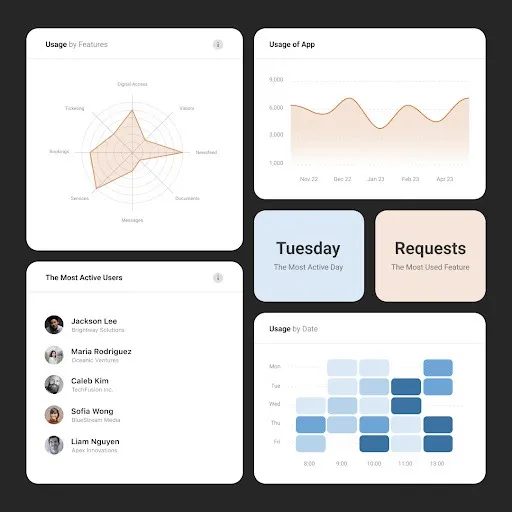
Instead of switching to a separate analytics platform like Power BI or Tableau, users can access dashboards, charts, and insights right inside the tools they already use, such as a customer relationship management tool, project management app, or any other SaaS platform.
Embedded analytics works by connecting data sources, processing that data through an analytics engine, and displaying insights directly inside another software’s interface.
It pulls information from databases or APIs, prepares it through calculations and models, and then presents it visually through dashboards, charts, or reports that fit naturally within the host application. The right embedded analytics platform can help you protect sensitive data while showing it to the right audience.
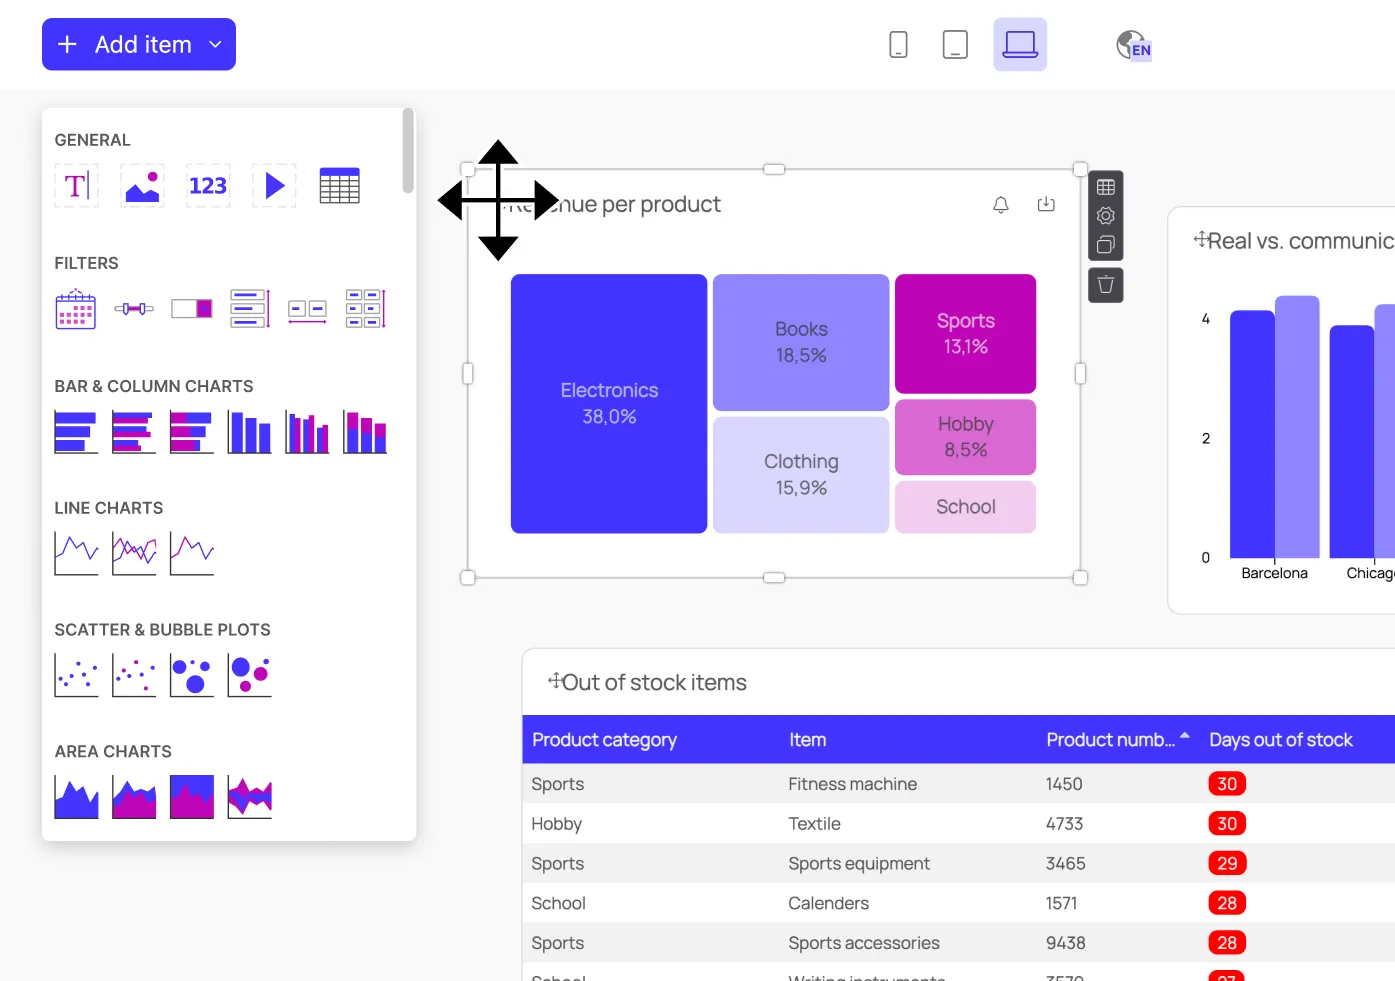
This integration can be done using iframes, SDKs, or APIs, allowing developers to match the analytics experience to their product’s design and user flow while keeping data secure and consistent in real time.
The benefits of embedded analytics for business
Embedded analytics or embedded business intelligence (BI) has quite a few advantages for SaaS companies.
First, the ability to get actionable insights from data visualizations. Your end-users may get some data points from your product, but in the form of raw numbers, it can be hard to interpret. Visualizing it through charts and graphs allows them to analyze data and make better decisions.
Speaking of which, that's the second benefit. With embedded analytics, customers can become more data-driven and understand what your product does and how it helps solve their pain points. For example, someone with a proposal tool can understand through graphs how many proposals they send and the percentage that gets signed and paid.
Third is the ability to upsell and cross-sell existing customers. The ability to view metrics and do data analysis is something that many users will pay extra for, and you can sell it as an add-on to existing plans, for customers who want data-driven insights from your product.
This also brings competitive differentiation, as many of your competitors may think that coding data analytics capabilities from scratch or purchasing a separate analytics tool can be expensive. On the contrary: modern embedded analytics platforms are affordable and an excellent way to stand out in a crowded market.
This brings us to our next point: embedded analytics tools are beneficial for developers, because they can get them up and running in hours. Manually coding embedded dashboards (and especially something more sophisticated such as self service analytics) can take weeks to months.
And then there's the costs. Independent software vendors such as Luzmo can sell you embedded analytics capabilities at a fixed monthly fee, which includes maintenance and possible bug fixes. The embedded analytics cost is significantly smaller compared to building embedded BI in-house.
Finally, there's centralized data control. All analytics are powered by the same data infrastructure, so you maintain data consistency and reduce the risk of users making decisions from outdated exports or disconnected spreadsheets.
In short, you can get advanced data analytics capabilities at a low, predictable cost, with advantages for your product, revenue and business users.
But none of that matters if you don't understand how embedded analytics work in real life and what other businesses like yours use them for.
The best embedded analytics use cases in 2025
Here are some ways you can implement embedded analytics solutions in your business.
Self service analytics for HR software providers
Use case: A SaaS product in the HR/people-management space wants to give non-technical users access to meaningful insights (e.g., dashboards of staff metrics, engagement, productivity) without having to build a full BI stack or rely on Excel exports.
Example: Kenjo integrated Luzmo and reported ~90% weekly adoption of dashboards within their HR app.
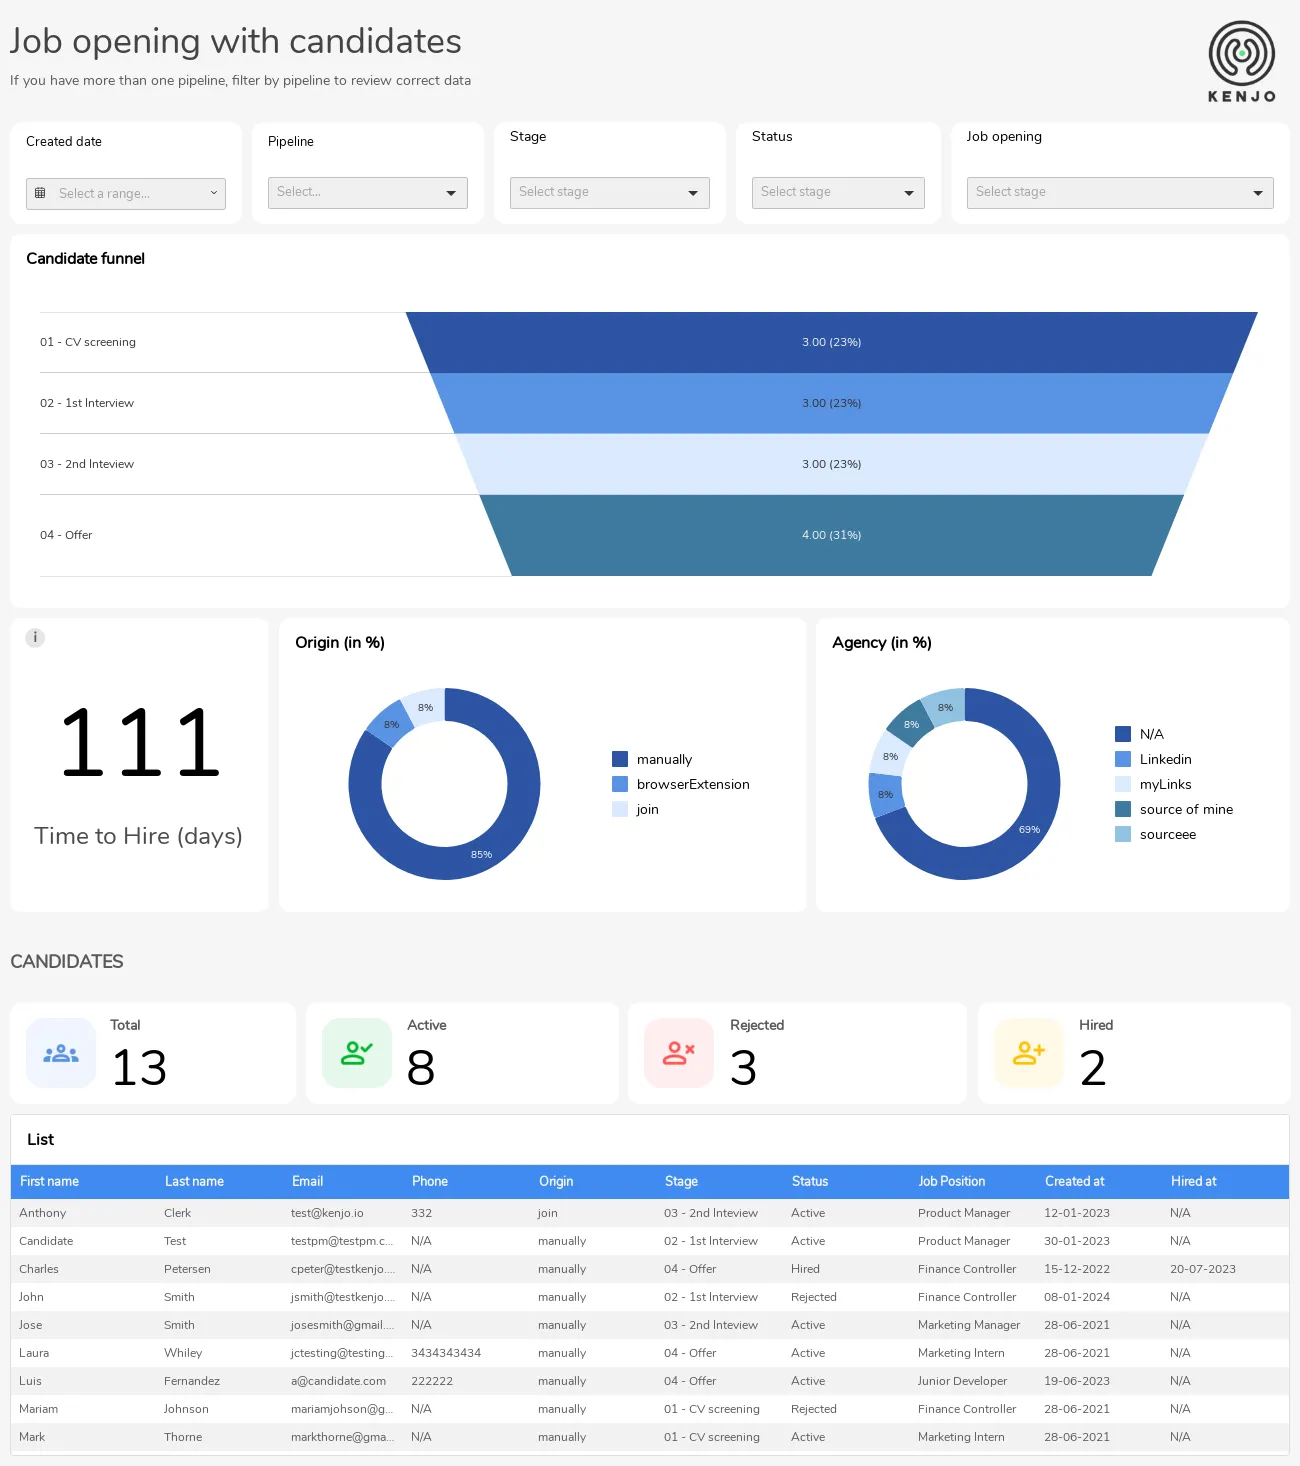
By embedding analytics, Kenjo made insights part of the user workflow, which helps drive engagement and value for their customers.
Occupancy & revenue insights for proptech companies
Use case: A shared-workspace platform wants to provide both operators and tenants with live visibility into space usage, sub-leasing revenue, and booking trends so they can optimize take-up, pricing, and utilization.
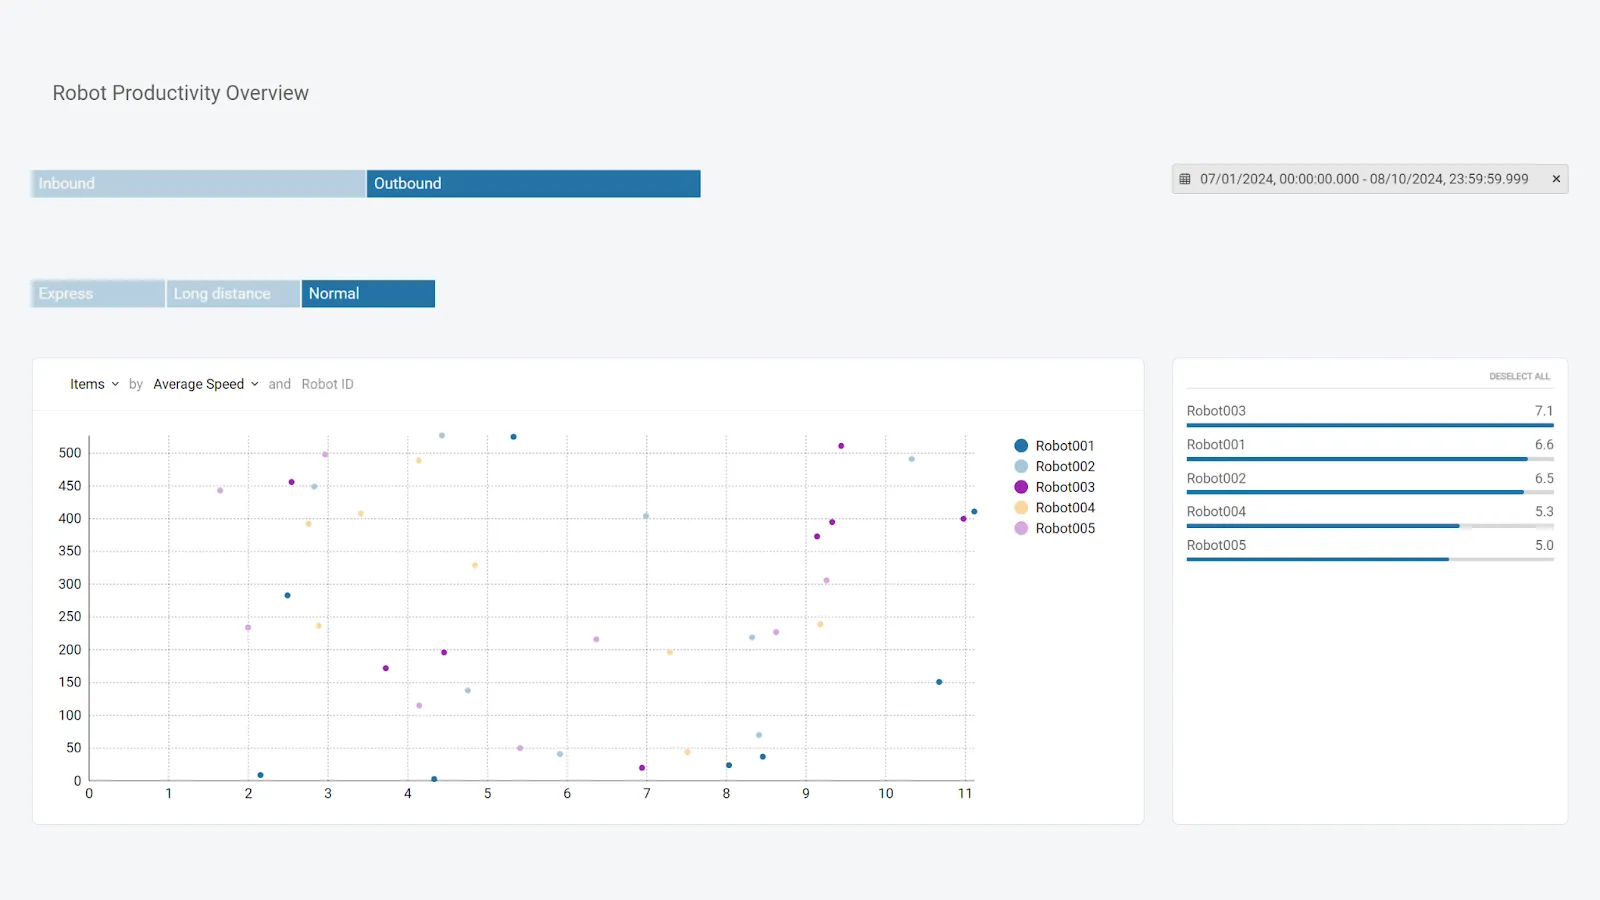
Example: Workero uses Luzmo to embed dashboards showing metrics like the number of available desks/offices, the type of space free, average rental revenue, bookings by source, and more.
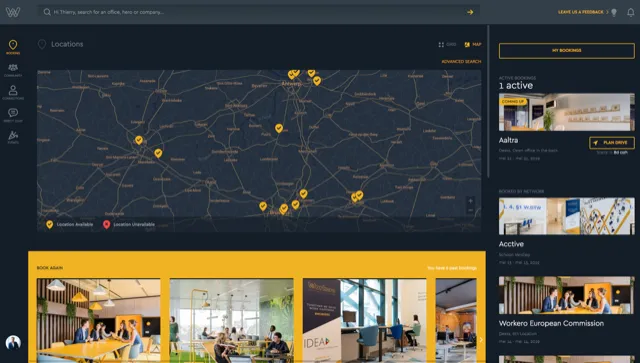
This enables their customers to evaluate which spaces are under-utilized and where revenue is coming from, directly within the SaaS interface (rather than exporting to separate reporting tools).
Self-service dashboards for broad audiences
Use case: A public-sector agency wants to publish large volumes of statistical data (municipality-level, age, income, demographics, etc.) via self-service dashboards so that journalists, researchers, or the public can explore data without needing raw spreadsheets.
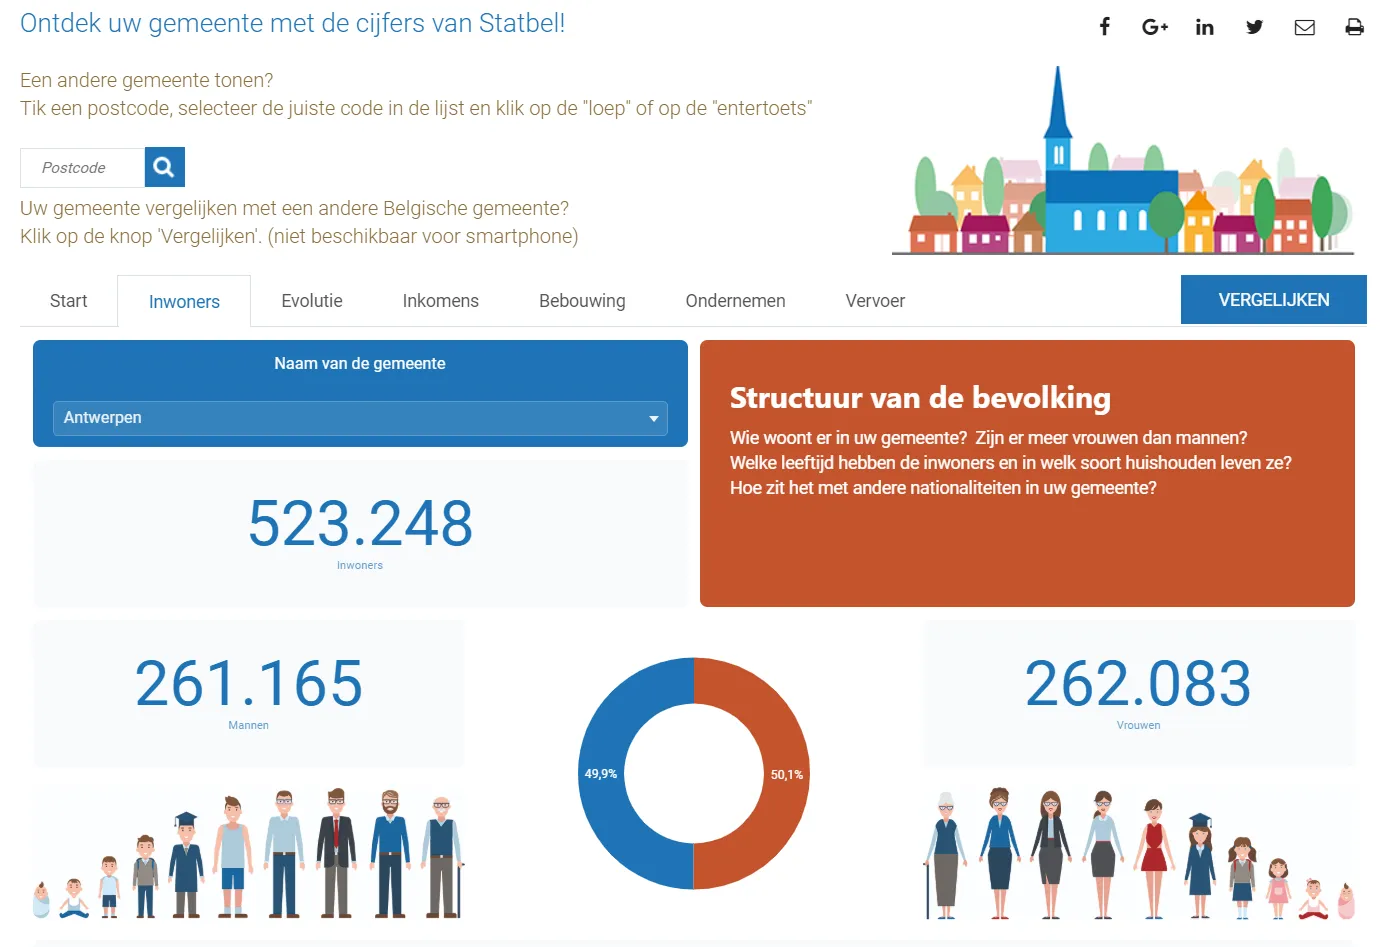
Example: Statbel (Belgian statistical office) used Luzmo to build an embedded analytics solution showing data for all Belgian municipalities (inhabitants, buildings, age/gender breakdown, etc).
This makes data more accessible and interactive, reducing dependency on manual reports and spreadsheets.
Improving visibility for manufacturing and inventory tracking
Use case: Katana, a manufacturing ERP platform, needed to give customers more flexibility to analyze production and stock levels without relying on static reports.
Example: With Luzmo embedded into its platform, Katana allows users to build personalized dashboards on production efficiency, order timelines, and materials usage.
Result: This shifted analytics from a developer task to an end-user capability, helping customers spot production bottlenecks faster.
Turning logistics data into custom analytics products
Use case: Element Logic, a warehouse automation leader, wanted to deliver analytics dashboards tailored to each client’s setup and KPIs.
Example: Using Luzmo’s Flex SDK, they created branded data products that visualize warehouse throughput, robot efficiency, and pick-rate trends.
Result: Clients gained operational transparency without switching systems, while Element Logic opened new revenue streams through analytics-as-a-service.
Modernizing reporting for global learning programs
Use case: Hult EF Corporate Education needed a scalable reporting system to serve enterprise clients with real-time program data.
Example: Luzmo replaced their legacy reports with embedded dashboards that display participation rates, learning progress, and ROI metrics.
Result: The move simplified report delivery for Hult EF’s teams and gave customers live access to their learning performance metrics.
Delivering project analytics inside a scheduling platform
Use case: Timewax wanted to help project-based businesses analyze resource allocation and profitability without external tools.
Example: Luzmo-powered embedded dashboards showing utilization rates, project progress, and billing efficiency.
Result: Customers gained full visibility into project data within Timewax, cutting dependency on spreadsheets thanks to using an embedded analytics platform.
Accelerating analytics delivery in IT asset management
Use case: Lansweeper, an IT asset management platform, wanted to add advanced reporting without spending years developing a BI solution internally.
Example: By integrating Luzmo, they built a full analytics layer in just weeks, giving users real-time insights into asset health, performance, and inventory directly inside the app.
Result: Customers can now track and visualize asset data instantly, improving decision-making while reducing engineering workload.
Reducing custom reporting workload for PropTech clients
Use case: Spaceflow needed to give property managers actionable insights into tenant engagement and building performance.
Example: By adding Luzmo dashboards, they replaced manual reports with interactive analytics visible to clients in real time, empowering them for data-driven decision making.
Result: Reporting requests dropped by roughly 80%, and customer satisfaction increased through on-demand access to data.
Top embedded analytics platforms to get data insights for your end users
There are some excellent embedded analytics tools out there, each with their pros cons, integrations and custom pricing models. Here are some of the best in the market and why you should choose them. From dedicated embedded platforms to traditional BI tools with embedding, your ideal tool will depend on the key features, data sources, and integrations you may need, among other things.
Luzmo
Luzmo stands out as one of the most developer-friendly embedded analytics tools on the market. It offers fast, interactive dashboards that can be fully customized to match any app’s interface.
Businesses choose Luzmo for its ease of setup, broad data source support, and lightning-fast performance even on large datasets.
Our Flex SDK lets teams embed analytics with complete design freedom, while features like multi-tenancy, role-based permissions, and white labeling make it ideal for SaaS companies building data products.
If you want to see the full benefits of embedded analytics in action, get a free demo of Luzmo today.
Looker
Now part of Google Cloud, Looker is a BI platform focused on data modeling and centralized governance. It’s strong for organizations that want consistent definitions of metrics across teams, powered by its LookML modeling layer.
While it provides solid embedded analytics capabilities, customization often requires development time and configuration through Google Cloud infrastructure. It's a full-fledged business intelligence tool which means that integrating embedded analytics is neither simple nor cheap.
Power BI
Microsoft Power BI is a popular choice for internal analytics, known for its strong integration with Excel and Azure. It supports embedding dashboards through iframes and APIs, but the experience is often limited in terms of UI control.
It’s best suited for companies already in the Microsoft ecosystem that need standard visual reporting rather than highly interactive or branded analytics inside customer-facing apps. In other words, it's not a dedicated embedded analytics solution and it will require some compromise.
Tableau
Tableau offers rich visualization options and supports embedding through JavaScript APIs. It’s powerful for creating complex dashboards and visual stories, especially for internal teams and data analysts.
However, embedding Tableau into SaaS products can be resource-heavy, and customization options are more limited compared to modern developer-first tools like Luzmo. This is a traditional business intelligence tool that offers a lot for internal users, but for embedded data visualizations, it's too complex and expensive.
Wrapping up
You no longer have to be a data scientist or machine learning expert to add data analytics software to your product. The strength of embedded analytics lies in its ease of use across the board, from setup to self-service analytics for end-users. All it takes is choosing the right tool. And there is no better choice than Luzmo.
Where traditional BI tools fall flat, Luzmo shines. Integrating analytics in your product has never been easier, with a slick user interface, excellent loading times, and connectivity with your most important data sources.
Book a free demo with Luzmo today to find out how to unlock new revenue streams and use embedded analytics so it works for you and your customers.
Written by

Ship the future of your data
Let us show you what Luzmo can do for your product.

Leave your e-mail and one of our analytics experts will reach out to you