 ChatGPT
 Perplexity
.png)
.png)
.png)
Build your first embedded data product now. Talk to our product experts for a guided demo or get your hands dirty with a free 10-day trial.

.png)
Embedded analytics has come a long way from being nice to have to something that has massive business value for SaaS products. Embedding analytics in your product unlocks a higher potential for revenue and increased customer satisfaction.
But much like thinking about a hobby and actually starting with it, launching embedded analytics is easier said than done. Unfortunately, the workload almost always falls on the product manager, who needs to balance the expectations of the executive team, the customers, and the end users.
Here’s why shipping embedded analytics can be so difficult on your product team and how you can help.
Embedded analytics is not a new concept.
Tools such as Power BI and Tableau have developed entire toolsets for embedding their dashboards, be it for internal use cases or for customer-facing applications. The problem is that these legacy tools work well for internal reports, but in embedded applications, they’re far from ideal.
Once we set aside the obvious issues (e.g., customization, multitenancy, and role-based access), the biggest problem is that to get these dashboards to work in an embedded setting, you need a lot of development work.
Traditional BI tools assume a controlled environment, a small set of users, and loose performance or UX requirements. Once analytics needs to live inside a product, engineering work multiplies. APIs must be built to expose metrics safely. Queries need to be optimized for frequent use. Frontend components must handle loading states, errors, and edge cases in a way internal dashboards rarely do.
If you want to use those same tools for embedding, your product manager has to be the one to communicate all the work that the engineering team has to do.
Competing priorities make this worse.
The same engineers needed for analytics are usually responsible for core product features, reliability work, and customer issues. Analytics and data visualization often lose priority because it does not block core functionality, even if customers ask for it loudly.
Testing and review also take longer. Because analytics touches sensitive customer data, changes go through stricter code reviews and security checks. That caution is justified, but it adds more steps before anything ships.
When a customer opens your SaaS tool and sees a dashboard with their data, they’re not comparing you against an Excel spreadsheet. They’re most likely comparing you to Instagram, Strava, or their favorite calorie-counting app. Even in B2B SaaS, the expectations are that the dashboards within the product should look great and load fast.
First is the overall UI and UX, since the dashboard needs to look the part and not be an isolated portion in a SaaS app. The overall design needs to match the rest of the app, and many traditional BI platforms struggle with this part because their analytics load through iframes.
Loading is the second issue because some SaaS platforms need to process large volumes of data before it’s displayed in dashboards. Optimization is necessary, as well as extra work on caching, query tuning, and infrastructure.
The product manager needs to find an analytics platform that is fully customizable and SaaS-ready. And since traditional enterprise BI tools (Power BI, Looker, Tableau) have clunky performance when embedded, the product team needs to look at embedded-first platforms built specifically for this use case.
If your CEO comes up and asks you to add embedded analytics to your SaaS platform (with customer-facing analytics, no less) in the next quarter and asks you to figure out ownership, what do you do?
The product team doesn’t have the technical capabilities to build out this function. However, they have to find the right platform that is:
The engineering team could help out with the bulk of this workload, but they’re already wrapped up in working on the main product and features. The data analytics team (if you’re big enough to have one) is probably a team of experts in internal reporting tools such as Power BI.
That leaves us with the product team, sitting at an awkward intersection of technical knowledge and customer requirements.
And when it’s time to implement embedded BI, no one is in a rush to take the lead, especially when you factor in something like multitenancy.
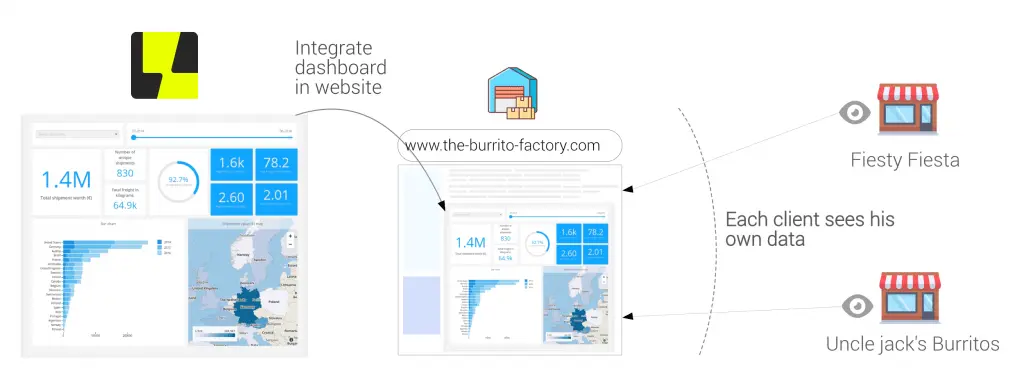
If you work in a company and need to send a sales report to your team, the solution is pretty simple: you send them a link to the dashboard where they can access the visualizations. With embedded analytics, things are a bit more complex.
Every user (or organization) using your product needs to see their data only. The product team has to answer questions like which customer can see which data, at what level of detail, and under which role. One mistake here means a potential data leak, which raises the bar for reviews and testing.
Then there is the issue of role-based access, where different people within the same organization can see different levels of data. For example, a manager will have access to all data points, while a sales rep can only access their own records.
Scale makes this harder. A query that works fine for one tenant may time out when run across a large account with years of data. Teams then have to introduce tenant-aware indexing, partitioning, or caching strategies, none of which are quick to implement or easy to maintain.
Data readiness is often the quietest but most stubborn reason embedded analytics slows down.
Most product databases are built to support features, not analysis. Events are logged to make the app work, not to answer questions later. When a PM asks for a metric, teams often realize the required data was never captured, was captured inconsistently, or lives across multiple systems.
At that point, shipping analytics means going back to add tracking, waiting for new data to accumulate, and sometimes migrating historical records.
Definitions are another common issue.
What sounds like a simple metric often has no shared meaning across teams. One group may define an active user by logins, another by actions taken, and another by billing status. Until those definitions are agreed on and documented, analytics work stalls because no one wants to ship numbers that will be challenged later.
Data quality problems compound this. Missing values, duplicated events, timezone mismatches, and late-arriving data all surface once analytics is exposed to customers. Internal dashboards can tolerate rough edges. Customer-facing analytics cannot. That forces extra validation, backfills, and monitoring before anything goes live.
Real-time expectations add pressure.
Users expect metrics to update quickly and reflect what just happened in the product. If the data pipeline runs in batches or depends on overnight jobs, PMs are stuck choosing between slow analytics or a major pipeline overhaul.
For product managers, this means analytics work often uncovers foundational data gaps. Fixing those gaps is necessary, but it turns a small feature request into a longer data project, which delays shipping even when the UI work is minimal.
Most off-the-shelf dashboards come with their own layout rules, interactions, and visual language. Fonts, colors, spacing, and chart behavior often clash with the host product.
To make analytics feel native, you’ll need custom theming, flexible layouts, and tight control over interactions. Each customization adds design and engineering work, which stretches timelines.
User context matters more than in standalone BI tools. In-app analytics should reflect where the user is and what they are doing. That means pre-filtered views, contextual defaults, and dynamic states tied to product actions. Building this level of context awareness usually requires custom logic and not simple embeds.
There is also tension between power and simplicity.
Some users want drill-downs, filters, and exports. Others want a single number or a simple trend. Designing experiences that serve both without overwhelming the interface takes multiple iterations, testing, and refinement. Product managers often need to cut scope or delay shipping while these decisions settle.
Responsiveness adds another layer. Analytics must work across screen sizes, inside modals, side panels, or compact views. Many chart libraries struggle outside full-page dashboards, which forces teams to rebuild or heavily modify components.
In practice, analytics UX becomes a product design problem, not just a data problem. When teams underestimate that effort, shipping slows as they rework designs to match user expectations and the rest of the product experience.
The core of the problem with embedded analytics is that traditional BI tools were simply not built for embedding. They’re complex to set up and customize, they require a lot of dev resources, and in the end, the dashboards will never feel like a native part of your product.
And we haven’t even touched upon the costs yet. Tools like Looker charge you not just for your team’s seats, but also for every end-user and their data usage, which can cost over $100,000 annually.
The solution is simple: using an embedded analytics platform that works like an extension of your product and not a hurdle for the product and engineering team.
With Luzmo, you get the building blocks for adding embedded analytics capabilities in your SaaS. Thanks to Luzmo Flex SDK, your developers will be able to code custom analytics that match the UI and UX of your product. It looks sleek, loads ultra fast and integrates within days instead of weeks or months.
You can ship the analytics portion of your product more quickly and your end-users get to insights more quickly, too. Not to mention that pricing is super transparent too, unlike most of the competitors mentioned above.
Book a free demo with our team to learn more.

All your questions answered.
Build your first embedded data product now. Talk to our product experts for a guided demo or get your hands dirty with a free 10-day trial.


