6 Best Data Visualization Tools for SaaS in 2026
Let’s set the scene. You’re rolling out a new SaaS feature. Your team is proud. But when users log in, the first questions aren’t about the new automation or fancy UI. They’re about the numbers:
“How do I see which customers are using this?”
“How is the growth trending for my region?”
“Can I break this down by team, product, or time?”
Too many SaaS companies answer with “Just go to the Analytics tab.” But for most users, that’s where momentum dies.
- Charts are static—they can’t drill, filter, or even sort.
- Data is outdated—reports refresh once a day, maybe.
- Visualizations are generic—everyone gets the same KPIs, regardless of their goals.
- Branding is off—the dashboard feels like a third-party afterthought.
- Getting a new report means a support ticket.
No wonder users bounce to Excel or ping the product team for screenshots.
Here’s the truth: Data visualization in SaaS isn’t just about showing data. It’s about creating a dynamic, product-led experience that turns numbers into action. It’s about empowering every persona to answer their own questions, drive decisions, and (crucially) feel ownership over your product’s value.
Recent user feedback and research—including the findings from Luzmo’s dashboard statistics—prove that SaaS buyers expect interactive, intuitive data viz that’s woven into the product, not tacked on.
This is the difference between tools that get ignored and those that drive retention, expansion, and real advocacy.
What SaaS teams need from data visualization tools
1. Embedded, not external:
Analytics should live everywhere your users work. Not just in a portal, but inside onboarding, admin, usage flows, or feature popovers. Every product touchpoint is an opportunity to visualize what matters, in context.
2. Interactivity and personalization:
SaaS users want to explore, not just watch. The best tools let them filter by cohort, drill into anomalies, or change chart types on the fly. Even better, every persona can save their own views, pin favorite KPIs, or share dashboards with their team.
3. Product branding and workflow fit:
Analytics is an extension of your SaaS brand. It should match your UI, carry your voice, and never break the user flow. White-labeling is no longer a luxury, it’s a must.
4. Scalability and security:
B2B SaaS means thousands of clients, all with unique data, roles, and permissions. True data viz solutions handle multi-tenancy, audit trails, and compliance out of the box.
5. Empowerment for both devs and business users:
You want a platform that’s low-code for product and ops teams, but gives full control (APIs, SDKs, workflow hooks) for when you need to innovate.
With that, let’s break down the top platforms that deliver on these needs in 2026.
1. Luzmo: Data visualization, built for SaaS product growth
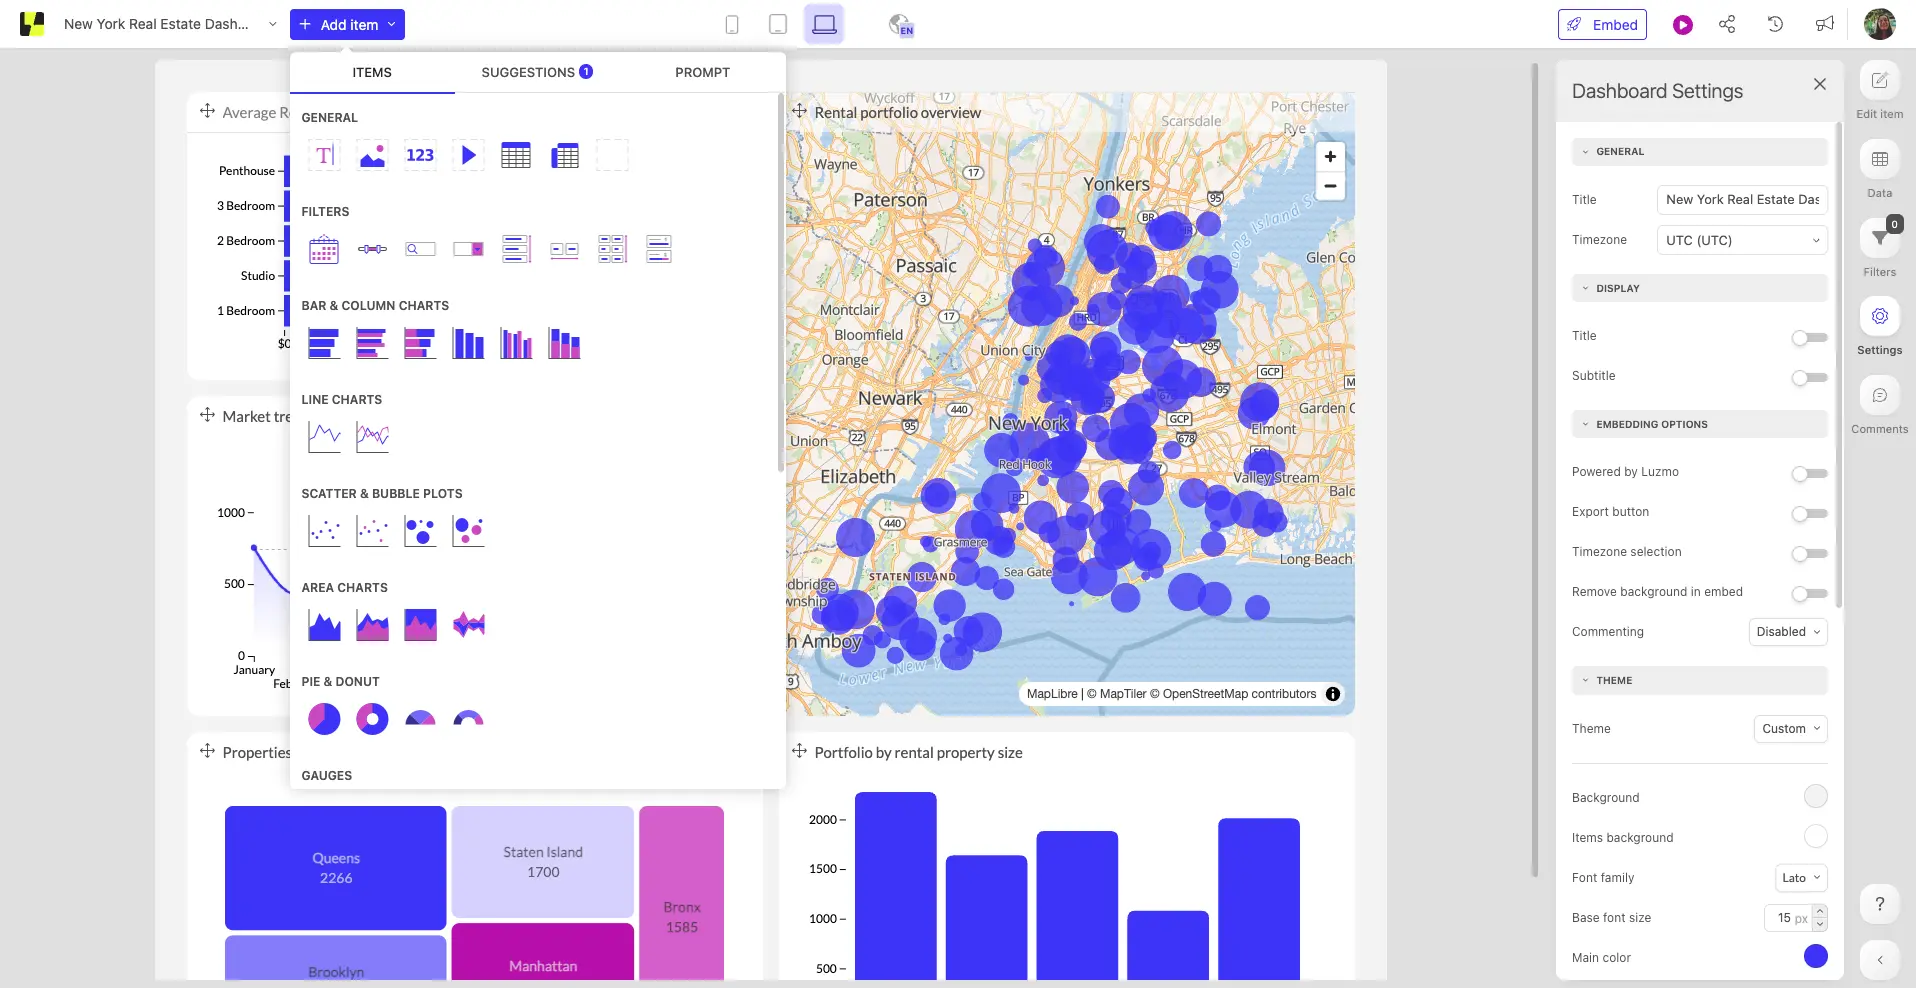
If you’re tired of dashboards that kill product momentum, Luzmo is your best bet. Luzmo is purpose-built for SaaS teams that want data viz to grow adoption, not just fill a checkbox.
What sets Luzmo apart:
- Luzmo’s embedded analytics lets you put interactive visualizations everywhere—from user onboarding to feature launches and renewal prompts.
- Luzmo Flex gives you drag-and-drop control, so dashboards, charts, and widgets can be embedded in any product workflow. No more “Analytics tab syndrome.”
- Luzmo IQ adds AI-powered insights and natural language queries—users ask questions in plain English and get live visualizations.
- White-labeling is standard: Everything matches your brand, right down to colors, layouts, and interactions.
- The embedded dashboard editor empowers end users and non-technical product managers to build, customize, and share their own dashboards—without IT.
- Luzmo Connect means you can hook into any data source, API, or spreadsheet, syncing everything in real time.
Real SaaS use case:
A SaaS HR platform needed to show hiring managers real-time team growth, diversity stats, and onboarding metrics, embedded right inside the app. With Luzmo, they built modular widgets for every HR persona—driving up engagement and slashing support tickets for “Can you send me that report?” requests.
Not for:
Internal-only reporting or legacy BI scenarios where basic dashboards are “good enough.” Luzmo’s sweet spot is SaaS teams who see analytics as a lever for growth, not a back-office chore.
2. Sisense: Custom viz for dev-heavy SaaS (but be ready to build)
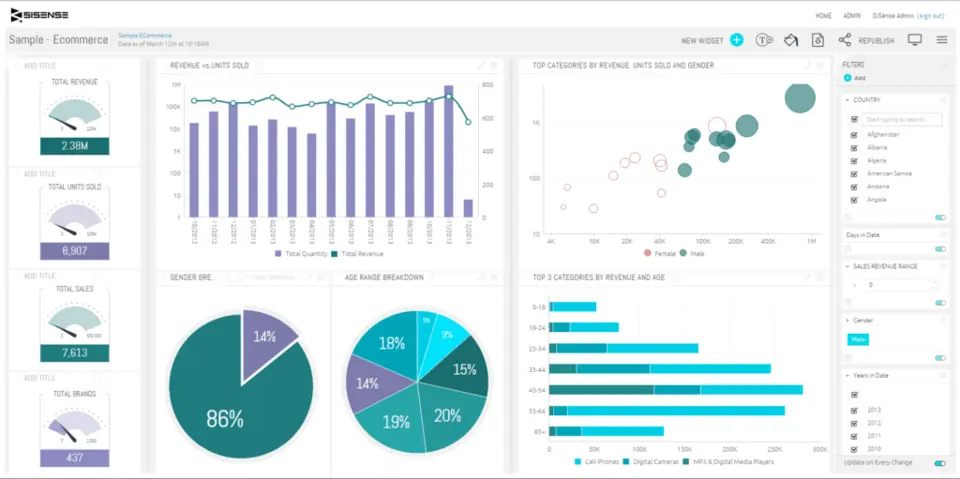
Sisense is the darling of dev-first analytics teams. You get full API access, a React SDK, and the freedom to build any data viz imaginable, but this power comes at a cost.
Strengths:
- Deep customizability: Use APIs and code to craft the exact visualization UX your SaaS needs.
- Widget-based design means you can place charts, filters, and KPIs anywhere in your app.
Real-world challenge:
Sisense reviews from actual product teams are blunt: Sisense is not plug-and-play. Initial setup takes serious engineering, and ongoing maintenance demands dev cycles. The visual experience is only as good as you make it, and many teams struggle to deliver true white-label SaaS UX.
Scenario:
A fast-scaling SaaS tried Sisense to power customer-facing dashboards. They soon found the cost (both time and dollars) of maintaining branded, snappy analytics UX was much higher than they’d planned. Quick iterations became a struggle, especially when every new feature needed analytics updates.
Best for:
SaaS orgs with an analytics dev squad and a long-term horizon for ROI. If you want rapid launches and self-service for business users, look elsewhere.
3. ThoughtSpot: Self-serve, search-driven data viz (but shallow for SaaS workflows)
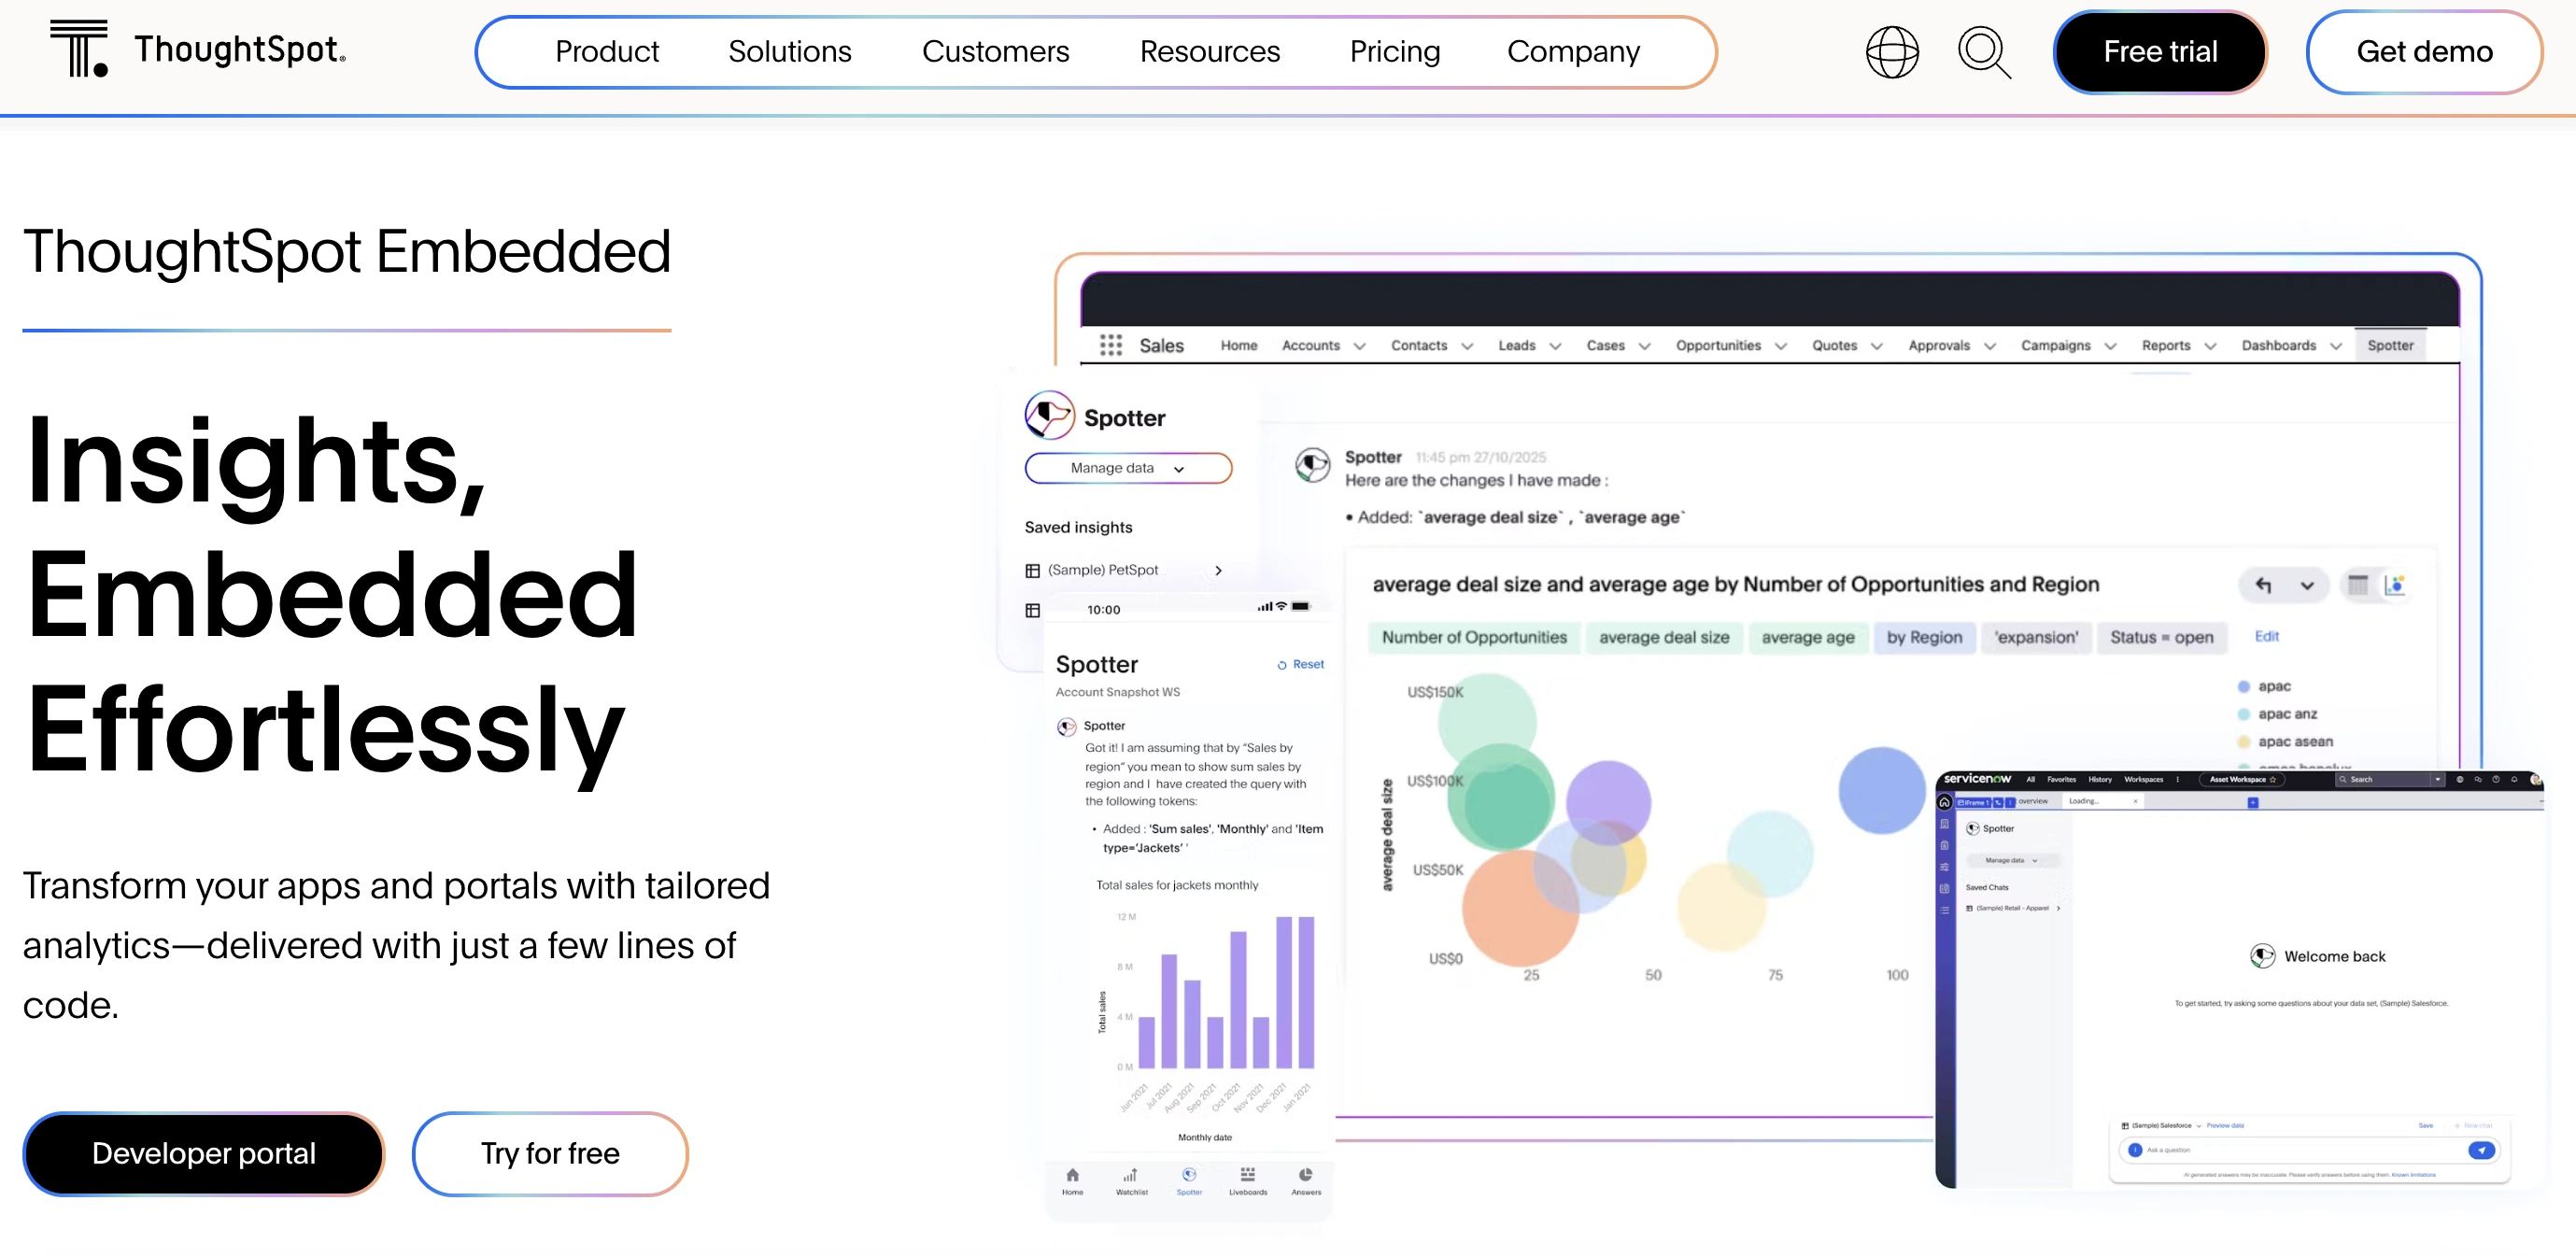
ThoughtSpot promises data democratization by letting users “search” for insights, Google-style.
Business users type questions and get instant visualizations: Liveboards that feel modern and smart.
Strengths:
- Truly intuitive for non-technical end users; no learning curve, just search and visualize.
- “Pin” and share liveboards in a couple of clicks.
Drawbacks from user sentiment:
- Embedding is basic. If you want deep SaaS workflow integration, custom triggers, or branded interactivity, ThoughtSpot can’t deliver.
- Visualizations look and feel generic, not product-native.
- As you scale, the cost structure and lack of advanced workflow support become major pain points.
Scenario:
A SaaS analytics PM tried embedding ThoughtSpot to let customers build their own insights. Users loved quick wins, but the moment the team needed advanced filters, custom workflow actions, or deeper branding, they ran into brick walls.
Best for:
SaaS apps serving business users who want quick, self-serve insights, but less suited for complex workflows or sticky, in-product engagement.
4. Metabase: Open-source data viz for SaaS startups (but outgrown fast)
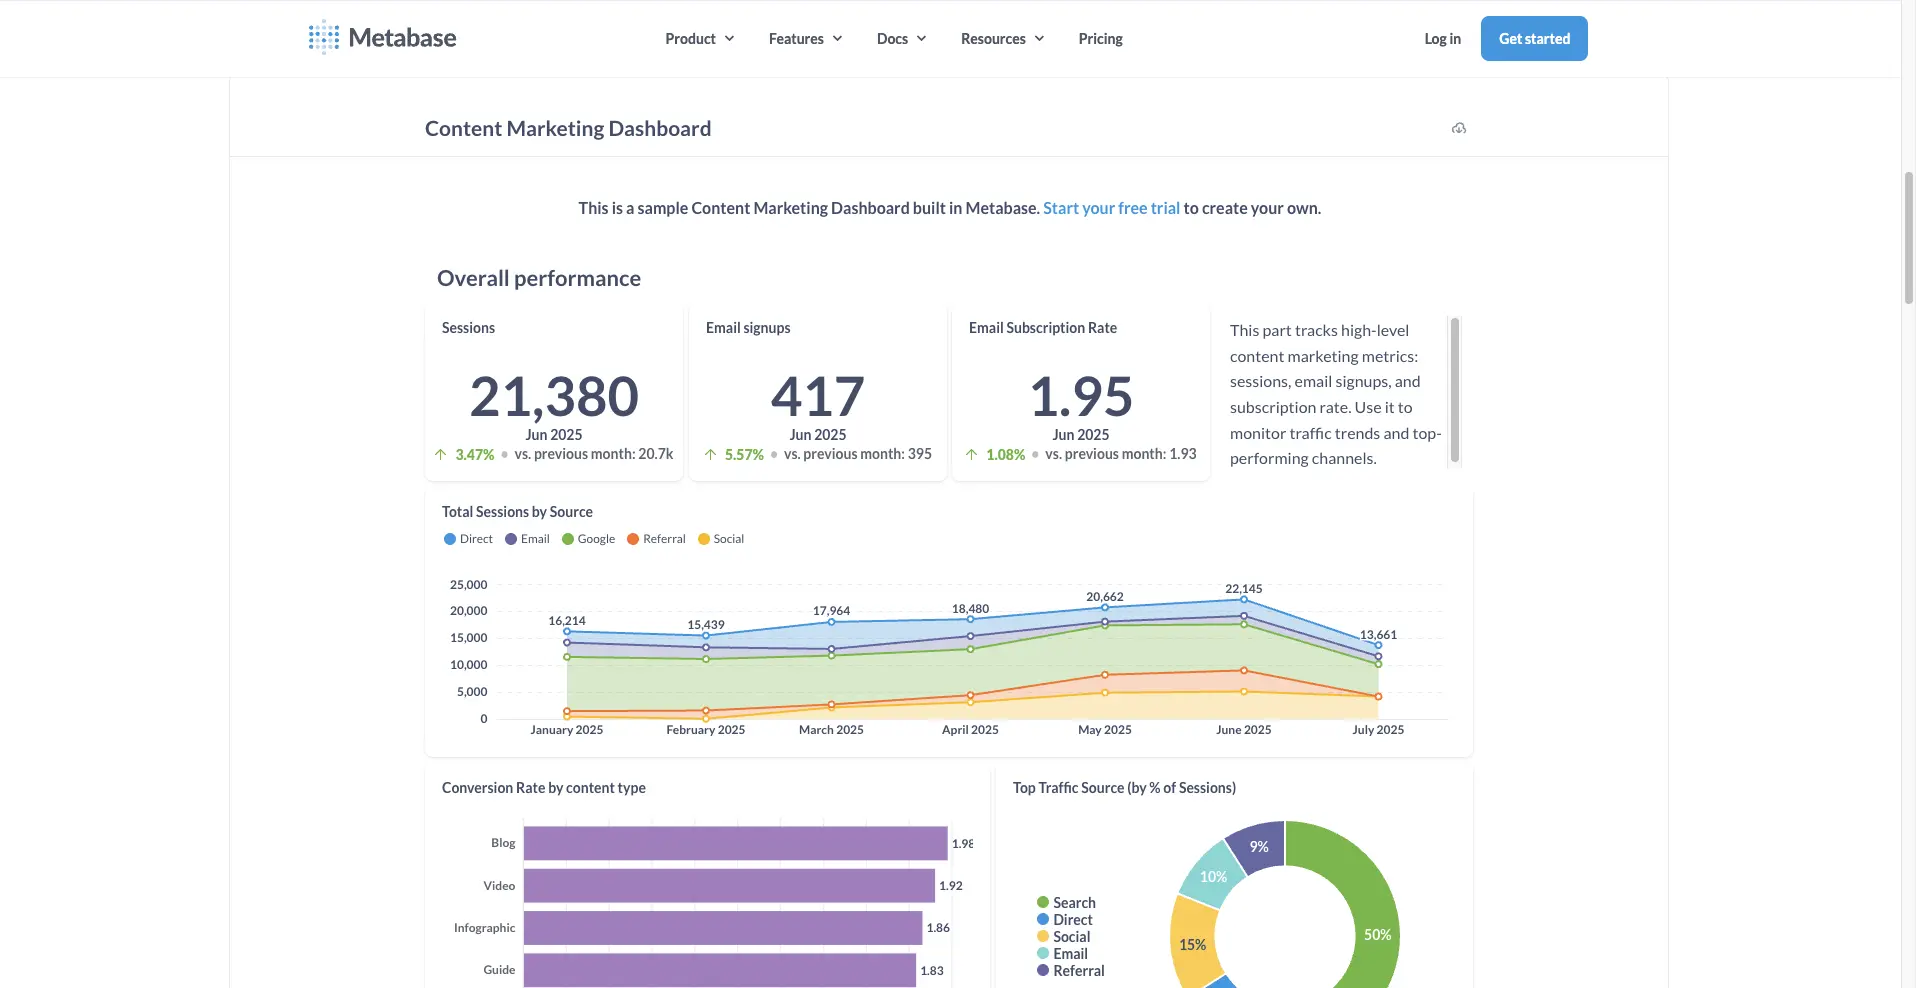
Metabase is the MVP hero: open-source, fast to embed, and easy for non-coders to use. Startups love the speed.
Strengths:
- Plug in, launch, and have data viz live within days, not months.
- The “question builder” UI is friendly, and embeddable charts make for flexible internal dashboards.
Weaknesses from your research:
- Multi-tenancy, security, and advanced customization are afterthoughts.
- Branding options are limited; you can spot a Metabase dashboard a mile away.
- When your SaaS product matures, you’ll either build workarounds or plan a migration. Metabase isn’t designed for heavy workflow or deep in-app analytics.
Scenario:
A SaaS team used Metabase for fast feature launches. As customer demands grew (custom reporting, white-label dashboards, user permissions), the team realized the pain of patching gaps. Migrating to a scalable solution became a project of its own.
Best for:
Early-stage SaaS, side projects, and teams who value speed over depth or polish.
5. GoodData: Headless BI with strong SaaS credentials (but technical lift required)
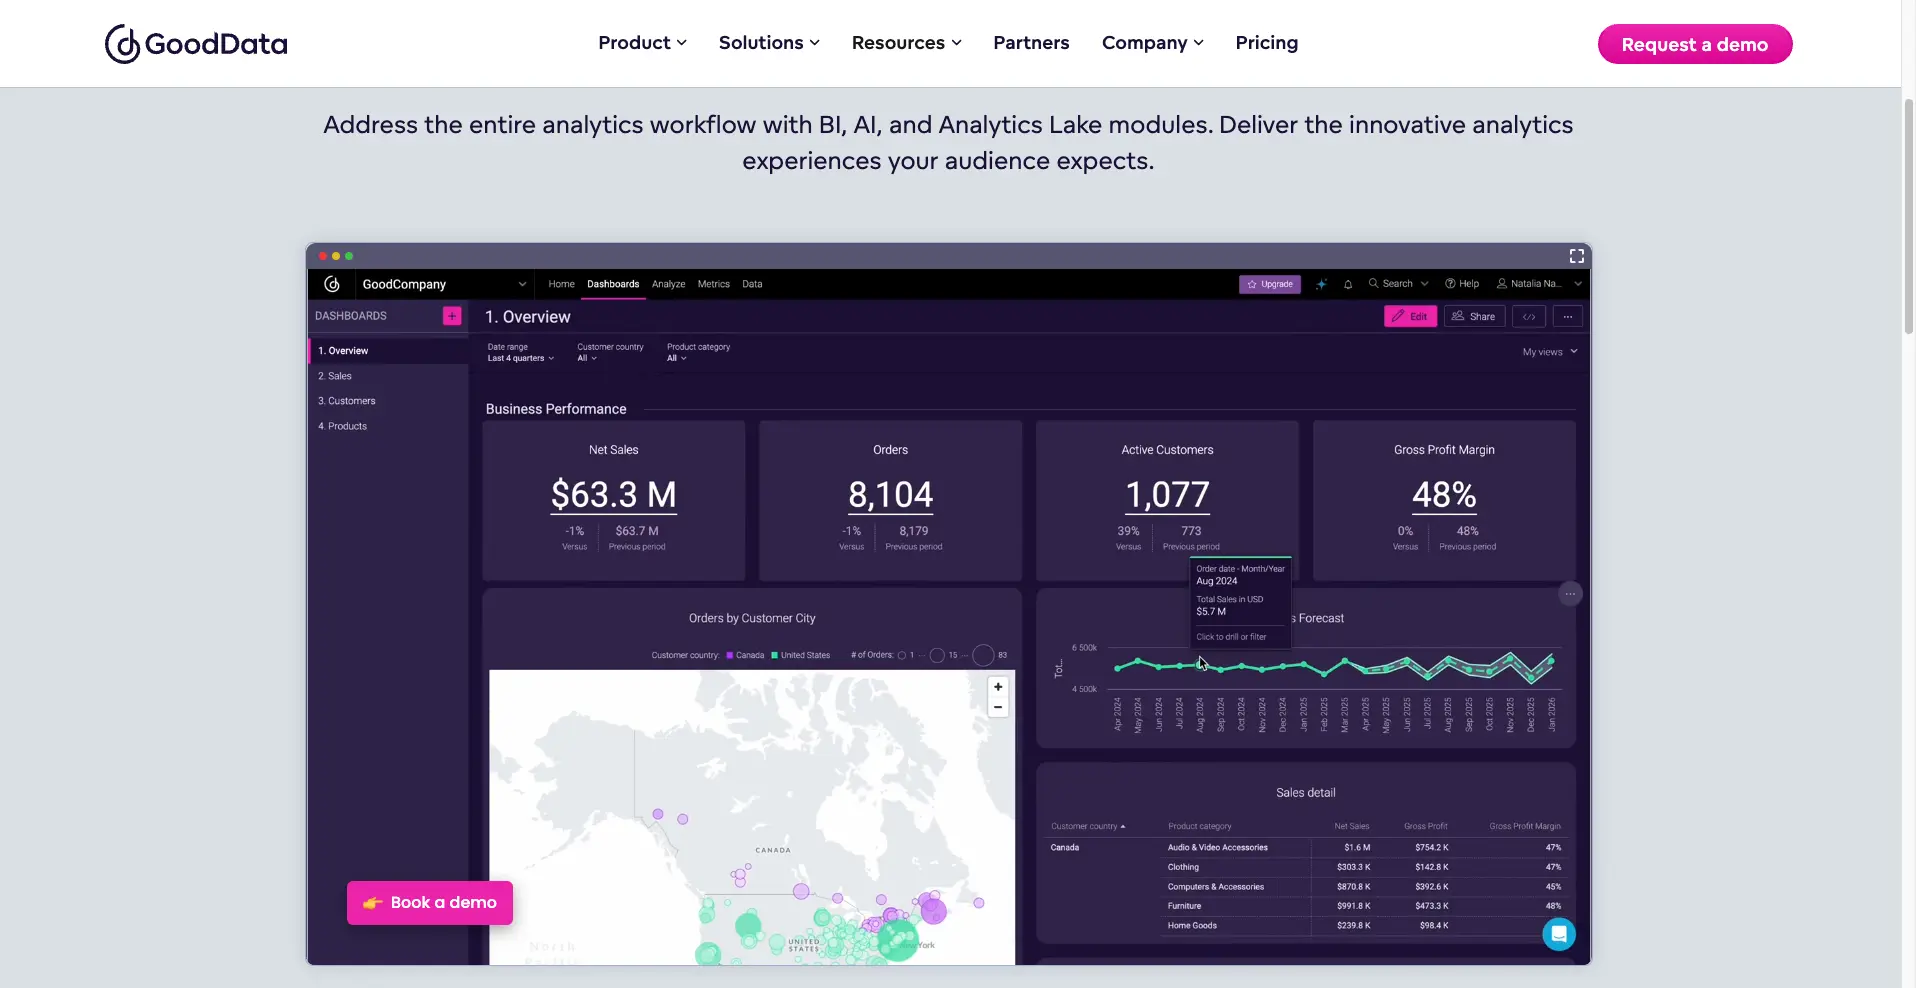
GoodData brings an API-first, multi-tenant approach that’s perfect for SaaS teams serving lots of B2B clients or needing strict compliance.
Strengths:
- React component library gives you granular control over every chart, filter, and workflow.
- Multi-tenant, secure, and ready for regulated environments.
Critical take:
- Out-of-the-box UI is underwhelming; your dev team must invest in front-end polish for anything beyond basic visuals.
- Deep workflow integration and branding require heavy lifting. Great for differentiation, but not “just drop it in and go.”
- Several users note steep learning curves and setup times, especially for teams new to headless BI.
Scenario:
A B2B SaaS serving banks used GoodData to deliver compliant, branded analytics. It worked, but only after months of engineering and a focus on front-end design.
Best for:
Mature SaaS, ISVs, and products where custom analytics experiences are a key market differentiator.
6. Power BI Embedded: Familiar, robust, but often feels “outside” the SaaS experience
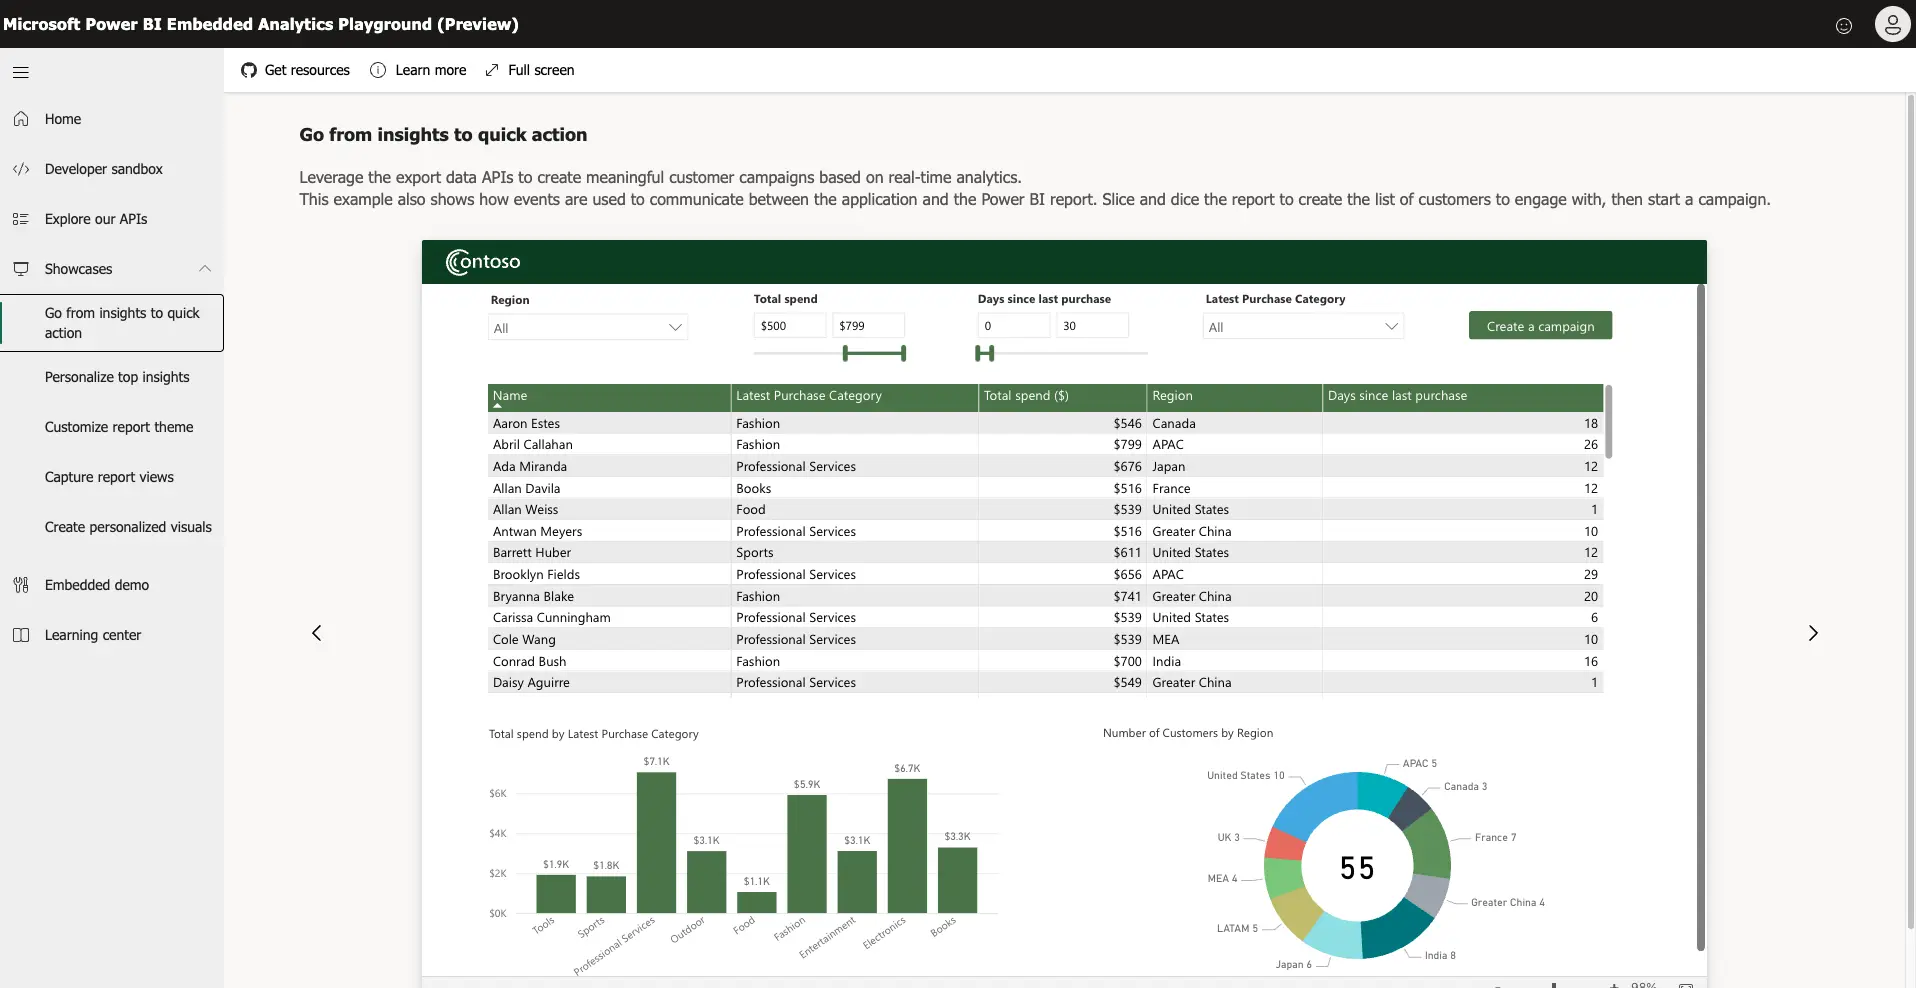
Microsoft’s Power BI Embedded is a staple for enterprise SaaS with deep Azure/Office 365 roots. If your users already live in Excel and SharePoint, they’ll be at home.
Strengths:
- Robust, secure, and well-supported by Microsoft.
- Drag-and-drop builder is familiar for business and data teams.
Drawbacks called out by SaaS product teams:
- Embedding is not truly native. Dashboards look and act like Power BI, not your SaaS product.
- Branding and workflow triggers are limited. Fast-changing products or those with high UX standards will find themselves boxed in.
- Usage-based pricing can lead to surprises as your user base grows, and time-to-feature can lag months behind product demand.
Scenario:
A SaaS company serving financial firms rolled out Power BI Embedded. Internal teams loved the reporting depth, but users kept leaving the platform for analysis, because the product experience felt clunky and disjointed.
Best for:
Enterprise SaaS where compliance, audit trails, and integration with the Microsoft ecosystem matter most. Less so for agile, product-led teams.
How to pick the best data visualization for your SaaS product
It’s tempting to focus on feature lists or shiny demos, but long-term SaaS success is about experience, speed, and integration. Here’s how to pick:
- Will your analytics live everywhere users need it, or just in a lonely “Analytics” tab?
- Can every persona—end user, manager, admin—customize their view and own their insights?
- How much will you need to invest in custom code, branding, or workarounds?
- Does the solution support multi-tenancy, role-based access, and compliance as you scale?
- How easy is it for business users to build and iterate, versus always waiting for a dev?
- Are you planning for rapid feature launches, or is your product static for the next 24 months?
Want hands-on guidance?
Request our SaaS data visualization matrix to compare each solution side by side: cost, flexibility, dev lift, and support for your real workflows.
Don’t settle for “just dashboards,” make data viz your SaaS superpower
In SaaS, the difference between user churn and product-led growth is often what happens the moment someone clicks “Analytics.”
If you treat data visualization as a box to check, your users will notice—and leave. If you make it a core part of every workflow, decision, and feature, you create a product that customers champion, not just use.
Luzmo stands out as the data visualization engine for product-driven SaaS teams.
Ready to move beyond dashboards?
See Luzmo’s embedded analytics, check how it compares, or book a demo and experience the future of SaaS analytics.
FAQ
All your questions answered.
What makes a data visualization tool suitable for SaaS products?
The best data visualization tools for SaaS products support embedded analytics, real-time interactivity, and deep customization. They should integrate directly into the product experience rather than forcing users into a separate analytics portal. Features like multi-tenancy, role-based access control, and white-labeling are also critical for B2B SaaS environments.
Why is embedded data visualization important for SaaS growth?
Embedded data visualization helps users understand the value of a product through actionable insights directly inside the app. Instead of exporting data or relying on static reports, users can explore metrics in context and make faster decisions. This leads to stronger engagement, higher retention, and better product adoption.
What should SaaS teams consider when choosing a data visualization platform?
Teams should evaluate how easily the platform integrates with their product architecture and data stack. It’s also important to consider scalability, customization, developer flexibility, and how easily non-technical users can build or modify dashboards. The right tool should support both product teams and developers without slowing down feature development.
Written by

Ship the future of your data
Let us show you what Luzmo can do for your product.

Leave your e-mail and one of our analytics experts will reach out to you