Looker Pricing: Price For Looker The BI Tool In 2026

You may have heard that Looker has decided to hike up their prices. Take a deep breath before panicking about your analytics budget or calculating how many office coffees you'll need to cut back on.
Looker pricing - the sticker shock
Looker was the BI tool that promised to change your data game. It offered solid features at a price that, while steep, was justifiable.
Looker doesn't publish its prices — it's sold through Google Cloud on a sales-led, annual-commitment basis — but independent estimates commonly put the platform licence in the tens of thousands of dollars a year (figures around $60,000 are frequently cited). For many businesses, that's enough to start looking at alternatives.
On top of the platform licence, expect:
- Dashboard viewers: per-viewer costs, with no free viewer tier (independent reports often cite roughly $400 per viewer per year). You pay for people to view the analytic dashboards.
- Dashboard creators and developers: building those dashboards costs more again.
- Variable extras: warehouse query costs and API limits in embedded use can add surprises to the bill.
Suddenly, you end up paying much more than you initially intended to. This happens because of:
- Per-user pricing (no free viewers)
- BigQuery/Snowflake usage costs (query-heavy dashboards)
- API call limits in embedded use
The hidden costs and headaches of this BI tool
There is even more to it. Their proprietary language, LookML, can take considerable time to learn and master.
It requires specialized training – meaning more time and money spent getting your team up to speed.
Embedding dashboards into your own applications?
Be prepared for a less-than-seamless experience with iframes that offer limited customization and can slow down your app's performance (but the experience varies based on dashboard optimization, data model efficiency, and whether cached queries are used).
Your users might need lots of patience waiting for dashboards to load, and customizing the look and feel to match your brand can feel like trying to fit a square peg into a round hole. On top of that, slow load times will cause frustration with your users.
When high pricing structure meets limited flexibility
All these challenges might have you wondering: Is Looker worth it?
High costs, technical limitations, and a frustrating user experience can hinder your business growth and leave your team searching for workarounds.
Looker pricing in 2026: what has changed and what to expect
Looker's pricing structure has continued to draw attention from analytics buyers in 2026. The platform is positioned as an enterprise BI tool, and its pricing reflects that positioning. Because Looker is quoted through Google Cloud rather than published, exact numbers vary by contract — but the platform licence (widely estimated in the tens of thousands per year) is separate from viewer and creator seat costs, API call volumes, and BigQuery query charges that accumulate with active dashboard use. A Looker platform typically includes a base of 10 standard and 2 developer users, with more added by negotiation.
The dimension that matters most for embedded use cases is per-user cost. In embedded scenarios — where dashboards are served to a company's own end users as part of a product — the number of viewers can scale to thousands or tens of thousands. If per-viewer costs run into the hundreds of dollars per year (as independent estimates suggest), a product with hundreds of active dashboard users can face six-figure viewer fees on top of the platform licence. That model works for internal BI with a defined, bounded user base; it becomes hard to justify at product scale.
If pricing is a blocker, compare embedded analytics tools built for product use cases.
To be fair to Looker, its embedding has matured — it offers an Embed SDK, signed/private embedding and, more recently, Gemini-powered conversational analytics that can be embedded — so the real trade-off for product teams is cost and the LookML skill requirement, not a lack of capability. The LookML requirement has remained a point of friction for teams evaluating Looker for embedded use. LookML is Looker's proprietary data modeling language. It is powerful for managing complex semantic layers across large organizations, but it requires specialized skills that most product teams do not have in-house. Onboarding time and the ongoing need for LookML expertise add to the total cost of ownership beyond the licensing fees.
For teams evaluating Looker in 2026, the most productive frame is total cost of ownership over three years rather than sticker price alone. Platform license, seat fees, query costs, implementation, and ongoing maintenance all contribute to the real cost — and the difference between what Looker charges and what alternatives charge is typically largest when that full picture is included.
The silver lining: an opportunity to explore Looker alternatives
Here's where things get interesting. Looker's price hike is less of a setback and more of an eye-opener. It's the perfect excuse to take a step back and reevaluate your analytics strategy. Maybe it's time to ask: Is Looker truly meeting your business needs, or is incurring costs only?
Identifying pain points
High costs are just the tip of the iceberg. Looker's steep learning curve, courtesy of its proprietary LookML language, can leave your team tangled in technicalities instead of focusing on insights. Limited customization and slow performance can frustrate users and hinder adoption across your organization.
Assessing value for money
With all these limitations, it's essential to question whether the hefty price tag aligns with the value you're receiving.
Are you investing in a business intelligence tool that propels your business forward, or are you pouring resources into a solution that hinders rather than helps?
The benefits of exploring alternatives to Looker
Better pricing = cost savings
Looking beyond the Looker platform opens the door to analytics solutions that offer similar or superior capabilities at a fraction of the cost. Imagine reallocating those funds to other critical areas, like marketing initiatives, talent acquisition, or product development.
Enhanced features
Modern analytics tools have evolved, providing advanced functionalities without the complexity.
From intuitive interfaces, upgrades, data modeling, actionable insights, connectors, templates, workflows, semantic modeling, and add-on options… these platforms can empower large enterprises and startups to derive meaningful analytics without jumping through hoops.
Improved user experience
User-friendly tools reduce the learning curve so your team can adopt the platform quickly and efficiently. When your analytics software is easy to use, it encourages widespread adoption – allowing you to build a data-driven culture across your organization.
Turning a price hike into a strategic advantage
Looker's price increase doesn't have to spell doom for your analytics budget. It's the perfect catalyst to explore solutions that align better with your needs and resources.
When you switch to another tool, you will most likely cut costs, but that's not all it offers. The tool you select should empower your team, delight your users, automate your operations, and scale your business.
However, not every alternative will live up to your expectations. You have to find a solution that matches the capabilities of your previous tool and offers advanced features and a better user experience.
Meet Luzmo.
Luzmo: powerful (embedded) analytics without the hefty pricing model
Luzmo is an analytics solution designed to make embedded analytics accessible, customizable, and, dare we say, enjoyable.
Features that outperform the Looker platform
- API-first approach: With Luzmo Agent APIs, you can embed analytics into your application with full control over customization – from data queries to dashboard behavior – all with minimal setup.
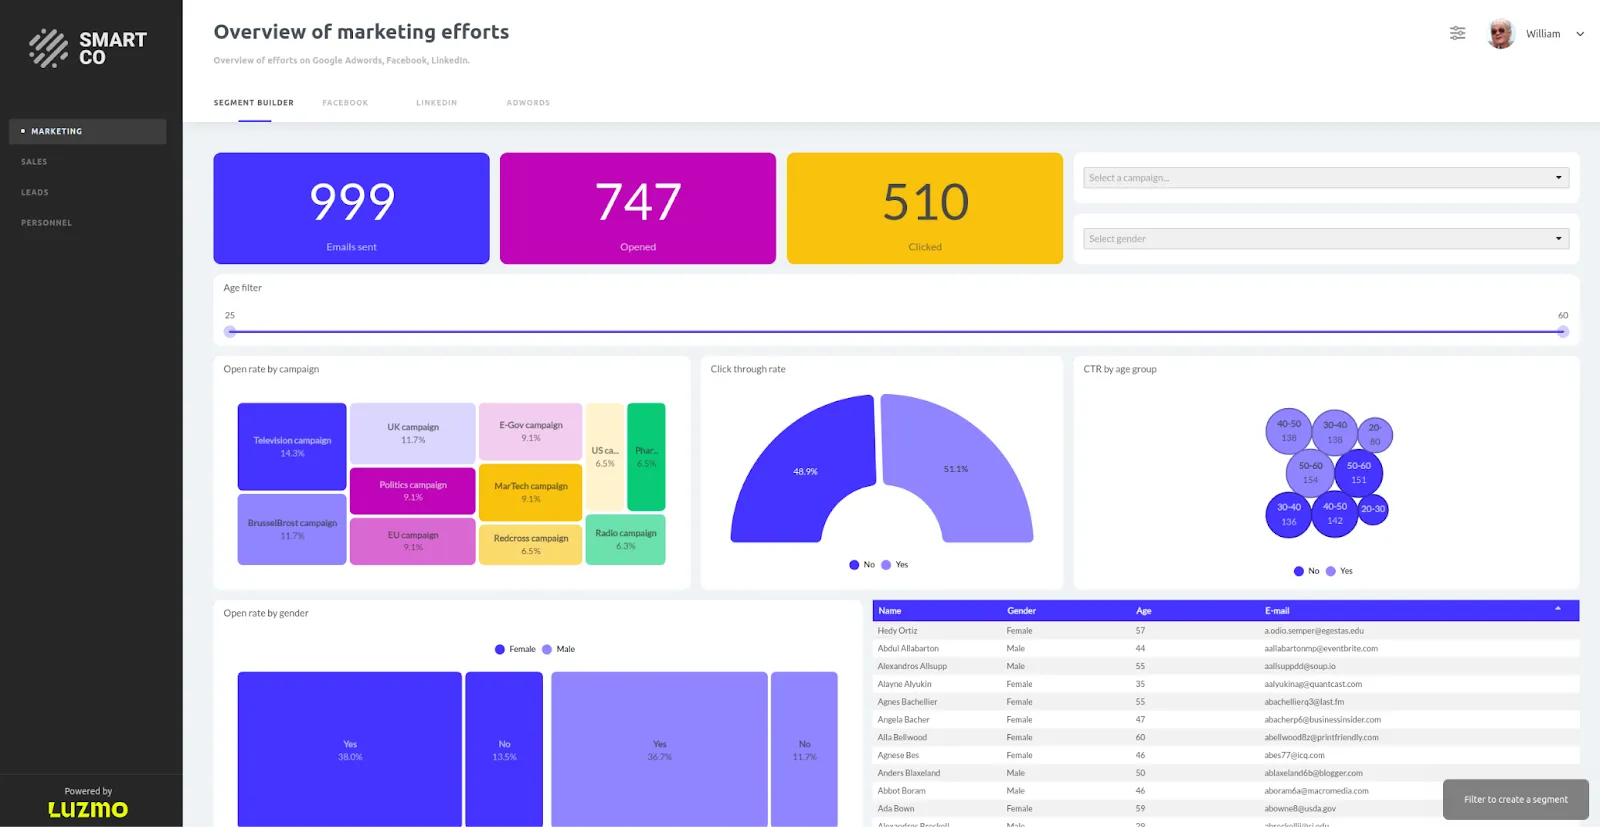
- Luzmo Studio dashboard editor: A drag-and-drop interface that lets you build stunning dashboards and visualizations effortlessly, without needing a data engineering degree.
- Whitelabeling and customization: Match the look and feel of your brand effortlessly across embedded dashboards, making every user interaction consistent and professional.
- AI Chart Generator: Leverage Luzmo IQ to create charts and insights automatically, saving time and helping both technical and non-technical users discover patterns faster.
- Responsive design: Dashboards adapt beautifully to any device because data doesn’t wait – whether it’s desktop, mobile, or in-app analytics.
- Luzmo Flex SDK: Enjoy complete flexibility to integrate analytics into your product’s UI with your preferred front-end libraries and frameworks like React, Angular, or Vue.
- Smart authentication mechanism: Keep access secure and seamless for every user while maintaining full control of permissions through single sign-on or API-based authentication.
Embed your first dashboard in less than 10 days.
Technical excellence without the headaches
- No proprietary language required: Skip the steep learning curve - no need to learn a new language like LookML.
- Performance optimization: Fast loading times mean your users get the data they need when they need it.
- Scalability: Whether you're just starting or scaling up, Luzmo grows with you.
- Comprehensive support: Access to resources like an extensive knowledge base, tutorials, and responsive customer service.
Luzmo pricing: transparent and predictable
Unlike Looker's $60,000+ annual price tag and per-user viewer fees, Luzmo offers straightforward, tiered pricing that scales with your usage — not with surprise line items.
Luzmo's Starter plan begins at €495/month (billed annually) and is designed for teams launching their first customer-facing dashboards. It includes essential drag-and-drop analytics and quick-start styling to align with your brand.
The Premium plan starts at €1,995/month (billed annually) and is built for growing platforms that need full whitelabeling, advanced analytics, proactive insights, and AI-assisted dashboarding.
For businesses requiring custom deployment, dedicated infrastructure, and enterprise-grade security and compliance frameworks, Luzmo offers an Enterprise plan with custom pricing.
All plans scale based on Monthly Active Users (MAUs), so you only pay based on actual usage — no per-seat fees for viewers, no hidden query costs.
Looker pricing vs. Luzmo: a total cost of ownership comparison
Comparing Looker and Luzmo on licensing fees alone understates the real difference for most embedded analytics use cases. The more meaningful comparison is total cost of ownership across the dimensions that actually affect the business.
Licensing and seat costs
Looker's platform licence (commonly estimated in the tens of thousands per year) sits before viewer or creator seats, and per-viewer costs add up with no free viewer tier. Luzmo's pricing starts at €495/month for Starter and €1,995/month for Premium, billed annually and scaled on monthly active users rather than per-seat viewers. For a product serving hundreds of active dashboard users, the licensing difference over three years is significant before any other costs are factored in.
Implementation and time to first dashboard
Looker implementations typically involve LookML development, data model design, and integration work that takes weeks to months depending on the complexity of the data environment. Luzmo is designed for developer self-service: most teams embed a working dashboard within days using the SDK documentation, without needing specialized data engineering support.
Ongoing maintenance
LookML models require ongoing maintenance as data models evolve. Changes to underlying schemas require corresponding LookML updates, and this maintenance work requires someone with Looker-specific skills. Luzmo's data modeling layer uses standard SQL and a visual interface, which is maintainable by the same developers who built the initial implementation.
For product teams running an embedded analytics use case at moderate to high user scale, the TCO difference between Looker and purpose-built embedded analytics platforms is typically substantial. Luzmo AI adds natural language querying and AI-powered insight generation on top of the core embedding capability — features that would require additional Looker add-ons or custom development to replicate.
Success stories: businesses thriving with Luzmo
Don't just take our word for it. Here's how companies like yours have transformed their analytics with Luzmo.
Accelerating retail analytics with SimpliField

Company: SimpliField, a mobile platform for streamlining retail operations.
Challenge: Needed to provide fast, user-friendly analytics within their platform without allocating extensive engineering resources to develop custom visualizations.
Solution: Integrated Luzmo's embedded analytics to quickly implement dashboards seamlessly embedded in their SaaS product, catering to different user personas like district managers and headquarters staff.
Results:
- Quick integration. Launched reporting features promptly without overburdening the development team.
- Improved user experience. Delivered fast, intuitive dashboards accessible via both desktop and mobile apps.
- Resource efficiency. Data scientists and engineers can focus on core product development rather than building analytics tools from scratch.
Real-time crowd management with Proximus
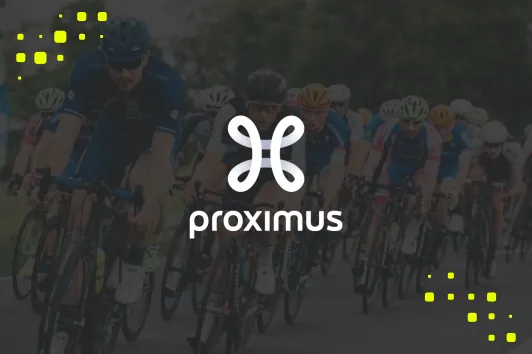
Company: Proximus, a leading telecommunications operator in Belgium.
Challenge: Required a real-time analytics solution to track crowd movements during large-scale events like the Tour of Flanders, aiding police and event organizers in crowd management and safety.
Solution: Utilized Luzmo's data visualization capabilities to create heatmaps from aggregated mobile phone signals, providing live insights into crowd densities and movements.
Results:
- Enhanced public safety. Enabled authorities to monitor crowd hotspots and deploy security teams effectively.
- Real-time insights. Successfully tracked approximately 800,000 spectators without compromising individual privacy.
- Pioneering effort. Achieved the largest real-time crowd management project in Belgium, improving coordination among crisis centers.
Interactive 3D analytics for construction with Apogea
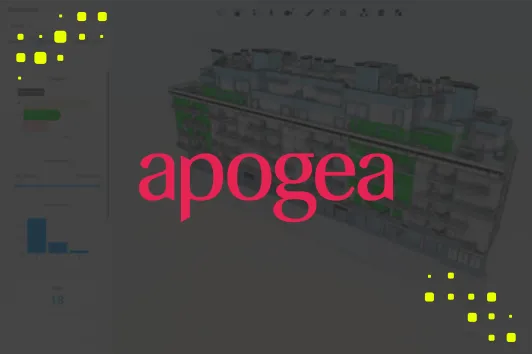
Company: Apogea, a technology consulting firm specializing in PropTech and civil engineering.
Challenge: Needed to help clients in the traditionally less digitized construction industry visualize and interact with complex data from 3D Building Information Models (BIM) alongside contextual project information.
Solution: Integrated Luzmo's embedded analytics to build interactive dashboards that overlay visual charts on top of 3D building models, allowing clients to explore data intuitively within their software platform.
Results:
- Innovative visualization. Provided next-level interactive 3D models powered by visual charts.
- Client empowerment. Enabled clients to make data-driven decisions across their entire portfolio.
- Competitive advantage. Offered a unique selling point that helped Apogea convince new customers of the value of data analytics.
Enhancing tenant experience analytics with Spaceflow

Company: Spaceflow, a PropTech SaaS company specializing in tenant experience solutions.
Challenge: Wanted to transition from a separate BI tool to an integrated analytics solution that offers a seamless user experience within their landlord portal.
Solution: Adopted Luzmo's embedded analytics to create beautifully designed dashboards fully embedded in their platform, ensuring consistent UX design and easy access to insights.
Results:
- Unified platform experience: Eliminated clients' need to use separate analytics applications.
- Significant reduction in data requests: Achieved up to an 80% decrease in generic analytics requests from clients.
- Improved decision-making: Landlords gained quicker access to key metrics, enhancing their ability to manage properties effectively.
Making the switch: easier than you think
Are you worried about the transition? Luzmo offers:
- A free trial: Test-drive the platform with no commitment.
- Dedicated support: On-demand assistance to help you every step of the way.
- Comprehensive resources: Access to the Luzmo Academy, developer docs, and platform status updates.
- Tailored plans: Can't find what you're looking for? Ask about custom plans, advanced admin and enhanced security features, or soaring active users. We’re happy to help!
Transparent and affordable pricing
Remember when pricing was straightforward and didn't require a meeting with your finance team? Luzmo offers clear, transparent, published plans:
Starter - from €495/month (billed annually)
- For teams launching their first customer-facing dashboards
- Drag-and-drop analytics, brand-aligned styling and the embedded dashboard editor
Premium - from €1,995/month (billed annually)
- Full whitelabeling, advanced analytics, proactive insights and AI-assisted dashboarding for growing platforms
Enterprise - custom pricing
- Dedicated infrastructure, advanced security and compliance, and custom SLAs
All plans scale with monthly active users (MAUs), so you pay for actual usage — no per-seat viewer fees, no hidden query costs and no surprise charges.
For those needing even more flexibility, Luzmo Flex offers a code-first SDK to build immersive data experiences directly into your application. Tailor every detail for an exceptional user experience. Contact sales for a custom quote.
Here's a concise comparison table highlighting the essential distinctions between Looker and Luzmo, especially regarding pricing and key features, to help you better understand how the two analytics solutions differ.
Platform pricing comparison: Looker vs Luzmo
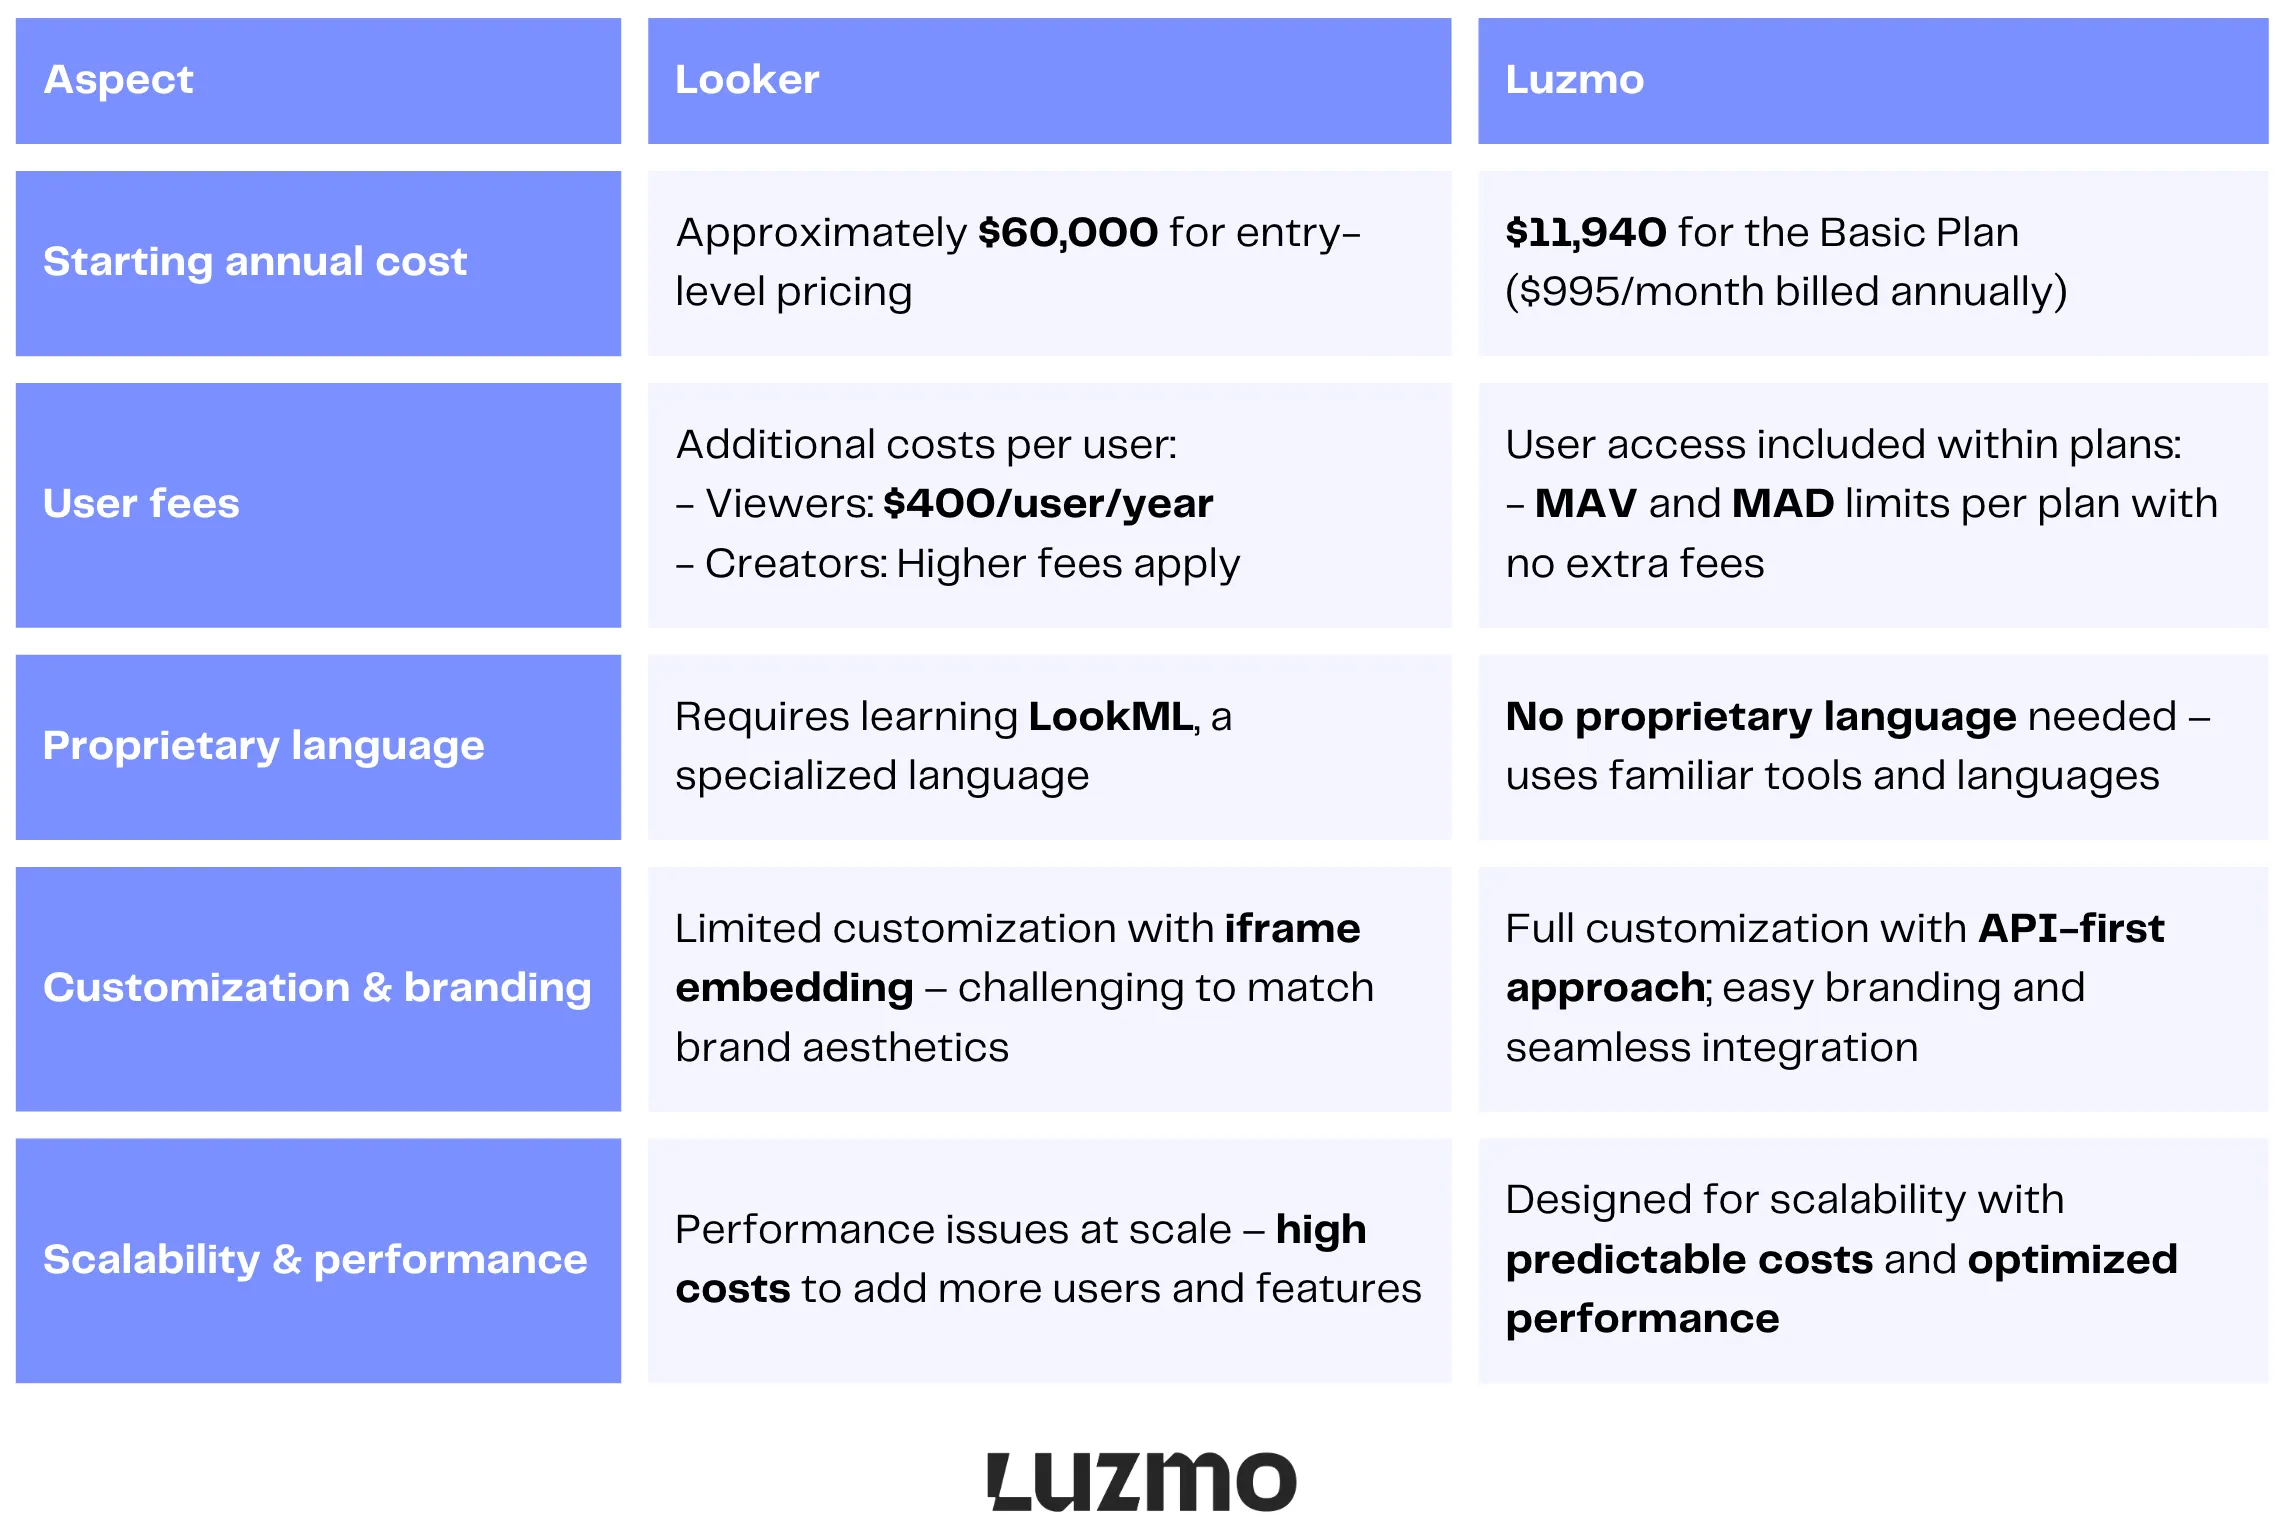
While Looker entails significant costs and complexities – including steep pricing, extra user fees, and the need to learn a proprietary language – Luzmo offers a more cost-effective and user-friendly alternative. Luzmo's transparent pricing plans include user access without hidden fees, and the platform itself is designed for easy customization and scalability.
You can also check alternative comparisons:
Before you switch – your checklist to follow
Switching from Looker doesn’t have to be complex. Use this step-by-step checklist to make sure your data, users, and setup migrate smoothly - without disrupting analytics operations.
- Audit your data sources: Identify all connected data sources in Looker, BigQuery, and other tools like Google Analytics or Power BI to ensure your new solution integrates smoothly.
- Review your datasets: Confirm that your existing datasets are properly formatted and structured for migration to Google Cloud or any compatible BI environment.
- Verify SQL compatibility: Check if your new data visualization platform supports SQL queries, so you can maintain the same workflows and logic used in external analytics and custom reporting.
- Check cloud storage requirements: Evaluate storage capacity for large datasets to make sure your new platform aligns with your Google Cloud project and doesn’t drive up costs unnecessarily.
- Assess developer users’ needs: Plan access for 2 developer users who will handle integrations, scripts, and automation, ensuring they have API access and sandbox environments in place.
- Review user licensing: Confirm your plan supports at least 10 standard users for everyday dashboard viewing and collaboration. Make sure pricing remains predictable compared to the price for Looker or other BI tools.
- Evaluate workspace setup: Create new workspaces that mirror your existing Looker environments to keep dashboards organized and maintain consistent access for end users.
- Ensure permissions management: Audit permissions and roles for both standard and developer users to avoid access conflicts when migrating from Looker.
- Identify key use cases: Map out the most important analytics and reporting needs that your new BI solution must support - especially those tied to external analytics and custom data applications.
- Test self-service capabilities: Make sure non-technical teams (e.g., sales team) can access and analyze data easily. Look for intuitive interfaces and self-service options, similar to Power BI, to boost adoption.
- Review documentation: Visit the official Looker software pricing page to compare plans and understand the cost differences before committing to a new BI platform.
- Ensure production instance readiness: Prepare your production instance for live data visualization and reporting, minimizing downtime when switching platforms.
Understanding Looker pricing and how it fits Google Cloud
It's worth being precise about product names, because Google offers two different things. Looker is the enterprise platform — LookML modelling, governance and embedded analytics — sold through Google Cloud on an annual-commitment basis and integrated with Google Cloud Core. Looker Studio (formerly Google Data Studio) is a separate, lightweight reporting tool with a free tier and a paid Looker Studio Pro option; it's aimed at quick dashboards, not enterprise semantic modelling or product-scale embedding. Don't apply Looker's enterprise pricing to Looker Studio, or vice versa.
For Looker (the enterprise platform), cost varies significantly with usage: the number of standard and developer users, how many production instances you run, monthly API call volumes, and the BigQuery/Snowflake query costs behind active dashboards. As part of the Google Cloud ecosystem, it also includes Google Cloud Support. The key is to size these variables for your actual use case — and to keep Looker's enterprise pricing separate from Looker Studio's much lower cost when you budget.
Is Looker worth the price? An honest evaluation for software product teams
For the right use case, Looker delivers real value. For the wrong one, the costs accumulate quickly and the tradeoffs compound. The use case question is the most important thing to resolve before evaluating whether the price is justified.
Looker is well suited for large enterprises with dedicated data teams who need to manage a complex semantic layer across multiple business units. LookML excels at centralizing business logic — defining metrics once and having them used consistently across hundreds of reports. The platform also has strong governance features, robust version control for data models, and a large ecosystem of integrations. If these are your primary requirements and you have the technical resources to maintain the implementation, Looker competes well at its price point.
Looker is less well suited for product teams building customer-facing embedded analytics. The per-viewer pricing model scales poorly with end-user volume. The LookML barrier slows implementation and raises the skill requirement for ongoing maintenance. The embedding experience via iframe has limitations on styling and performance that are difficult to work around. These are not dealbreakers for internal BI use, but they are significant constraints in a product context where the analytics experience is part of what customers pay for.
The honest evaluation framework is this: if you are building internal analytics for a defined set of power users and have a dedicated data team, Looker is worth serious consideration at its price. If you are building customer-facing analytics into a product and need to scale dashboards to end users, the pricing model and embedding architecture create structural friction that is worth accounting for before committing.
The bottom line: you deserve better
Your business deserves analytics tools that empower rather than hinder. A Looker account might have been great so far, but it doesn’t mean you have no alternatives now when the price is high.
Don't let high costs and cumbersome tools hold you back. With Luzmo, you get transparent pricing, powerful features, and a user-friendly experience – all without the sticker shock.
Ready to take control of your analytics? Try Luzmo for free or schedule a demo today. Your budget – and your team – will thank you.
Why settle for less when you can have more for less? Make the smart move today.
FAQ
All your questions answered.
Why doesn’t Looker list its prices publicly?
Looker’s pricing is negotiated through sales because it is designed for enterprise-grade analytics with highly variable needs (e.g., number of users, API usage, embedding, security features). This custom approach lets sales tailor contracts to company scale and complexity, but it also means you must contact the vendor to get an exact quote.
What factors influence how much Looker will cost my business?
Key drivers of your total investment include: Edition choice - Standard, Enterprise, and Embed tiers each come with different capabilities and limits. User mix - Viewer, Standard, and Developer licences have different cost impacts, and heavy use by many internal or external users scales costs. Query and API usage - high query volumes (especially for embedded use-cases) often require higher editions or add-ons. Implementation & training - LookML modelling and security setup typically require skilled personnel or professional services.
What is a realistic budget range for Looker if I’m evaluating it?
Independent price data suggests total annual contracts often fall between ~$35,000 and $150,000+ for internal business intelligence. Larger or customer-facing embedded analytics deals can exceed $150,000-$250,000+ depending on scale and customization - with median reported contract values around $90,000 per year.
Are there hidden or ongoing costs beyond the subscription?
Yes. Beyond base licensing, businesses should plan for a few other expenses. Data warehouse query costs (e.g., BigQuery/Snowflake). Professional services for implementation and LookML development. Training and onboarding for analytics teams. Higher tiers of API limits or support contracts if usage increases.
Written by

Ship the future of your data
Let us show you what Luzmo can do for your product.

Leave your e-mail and one of our analytics experts will reach out to you