Buyer's Guide to Embedded Analytics Platforms (2026)
Evaluating an analytics platform for internal reporting is a solved problem. Evaluating one that your customers will use inside your product is not, and most buyer's guides do not tell the two apart.
The difference is not features. It is that the moment analytics becomes part of what you sell, three things stop being negotiable: every tenant must see only their own data, the platform has to hold up when a thousand customers query it at once, and the surface has to look like your product rather than someone else's.
This guide covers what to require, how to test it during evaluation, and how to model the return. There is a scorecard and an ROI calculator at the end.
Embedded analytics and internal BI are not the same purchase
Embedded analytics platforms slip into apps and web tools, turning raw data into customer-ready insights. They are built for software teams who want to ship dashboards that engage and inform their users, without breaking a sweat on scale or security.
The distinction matters more than most evaluations allow for, because it changes what you are actually buying.
Internal BI serves people inside your company. The users are colleagues, the data belongs to one organization, permissions map to job roles, and a slow dashboard is an annoyance. If it breaks, someone opens a ticket.
Customer-facing analytics serves the people who pay you. The users are tenants, the data belongs to them rather than to you, permissions map to contractual boundaries, and a slow dashboard is a support conversation. If it breaks, it breaks inside your product, and your customer sees your logo on the error.
That difference shows up in three places during an evaluation:
- Governance becomes isolation. Internal BI asks who is allowed to see a report. Embedded analytics asks whether tenant A can reach tenant B's rows under any condition at all.
- Performance becomes concurrency. Internal BI is measured by how fast a report loads for one analyst. Embedded analytics is measured by how it behaves when hundreds of customers hit it at the same moment.
- Design becomes branding. Internal BI can look like the vendor's product. Embedded analytics has to look like yours, which makes white-labeling a requirement rather than a preference.
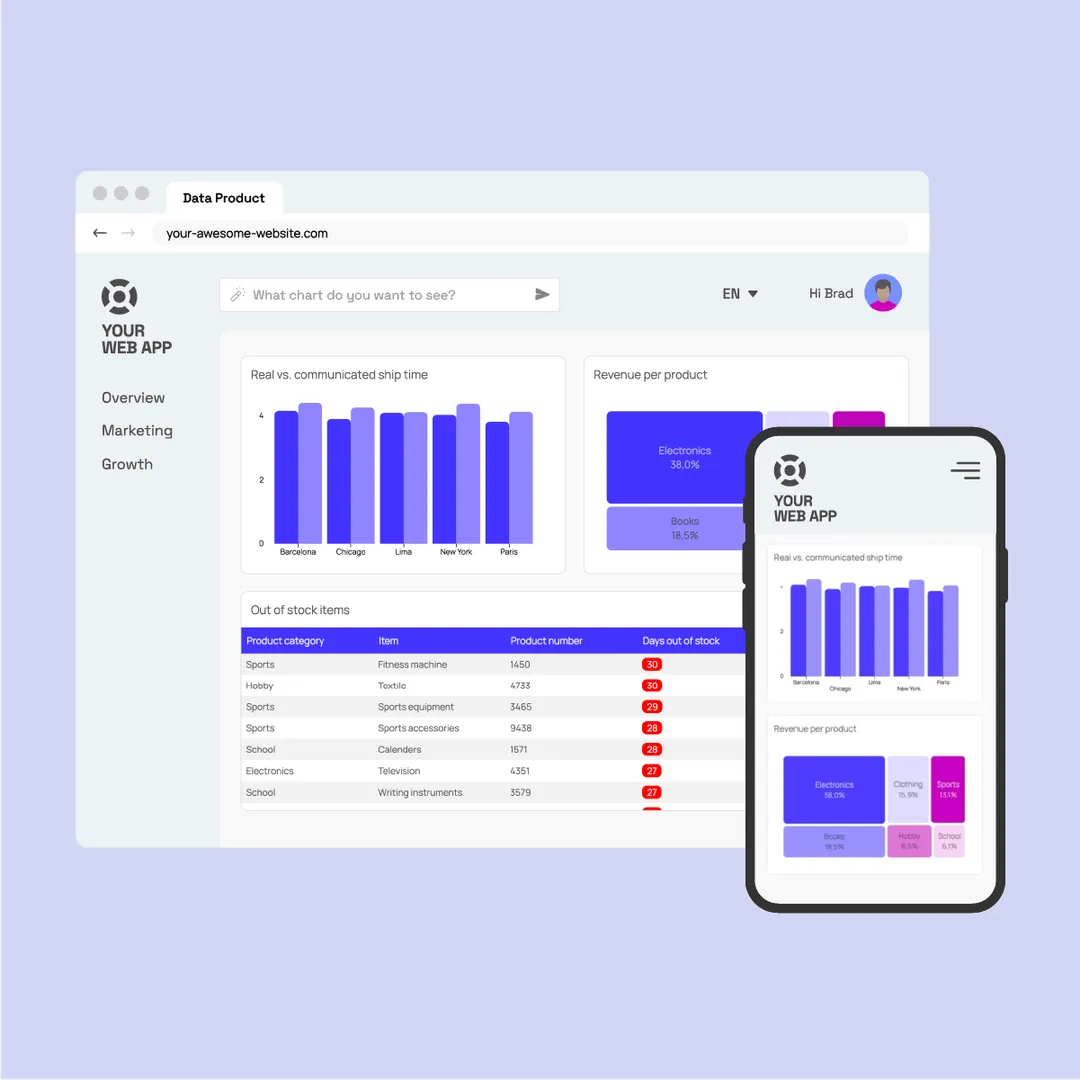
Use case: a SaaS company integrates Luzmo's embedded analytics into its platform to give users interactive dashboards covering their marketing campaign performance and customer engagement data. Those dashboards ship as part of the product, and they carry the product's name.
If your buyer is internal, most of the guidance below still applies but the stakes are lower. If your buyer is your customer, the sections that follow are where evaluations go wrong.
Key considerations when selecting an analytics platform
Scalability
Scalability is more than handling increasing data volumes. It is about adapting to changing business needs. As your organization grows, so will your datasets, user base, and analytical demands. A scalable data analytics platform holds performance whether you are dealing with big data or smaller, focused datasets.
Look for platforms that optimize resource allocation, enabling real-time analysis without bottlenecks. Whether you are scaling to support additional users or integrating new data sources, the platform should maintain speed and operational efficiency.
Usability
The most advanced analytics platform is ineffective if teams struggle to use it. Usability bridges the gap between technical users like data scientists and non-technical stakeholders, such as business users. The platform should feature intuitive visualizations and interactive tools that enable quick comprehension of complex insights.
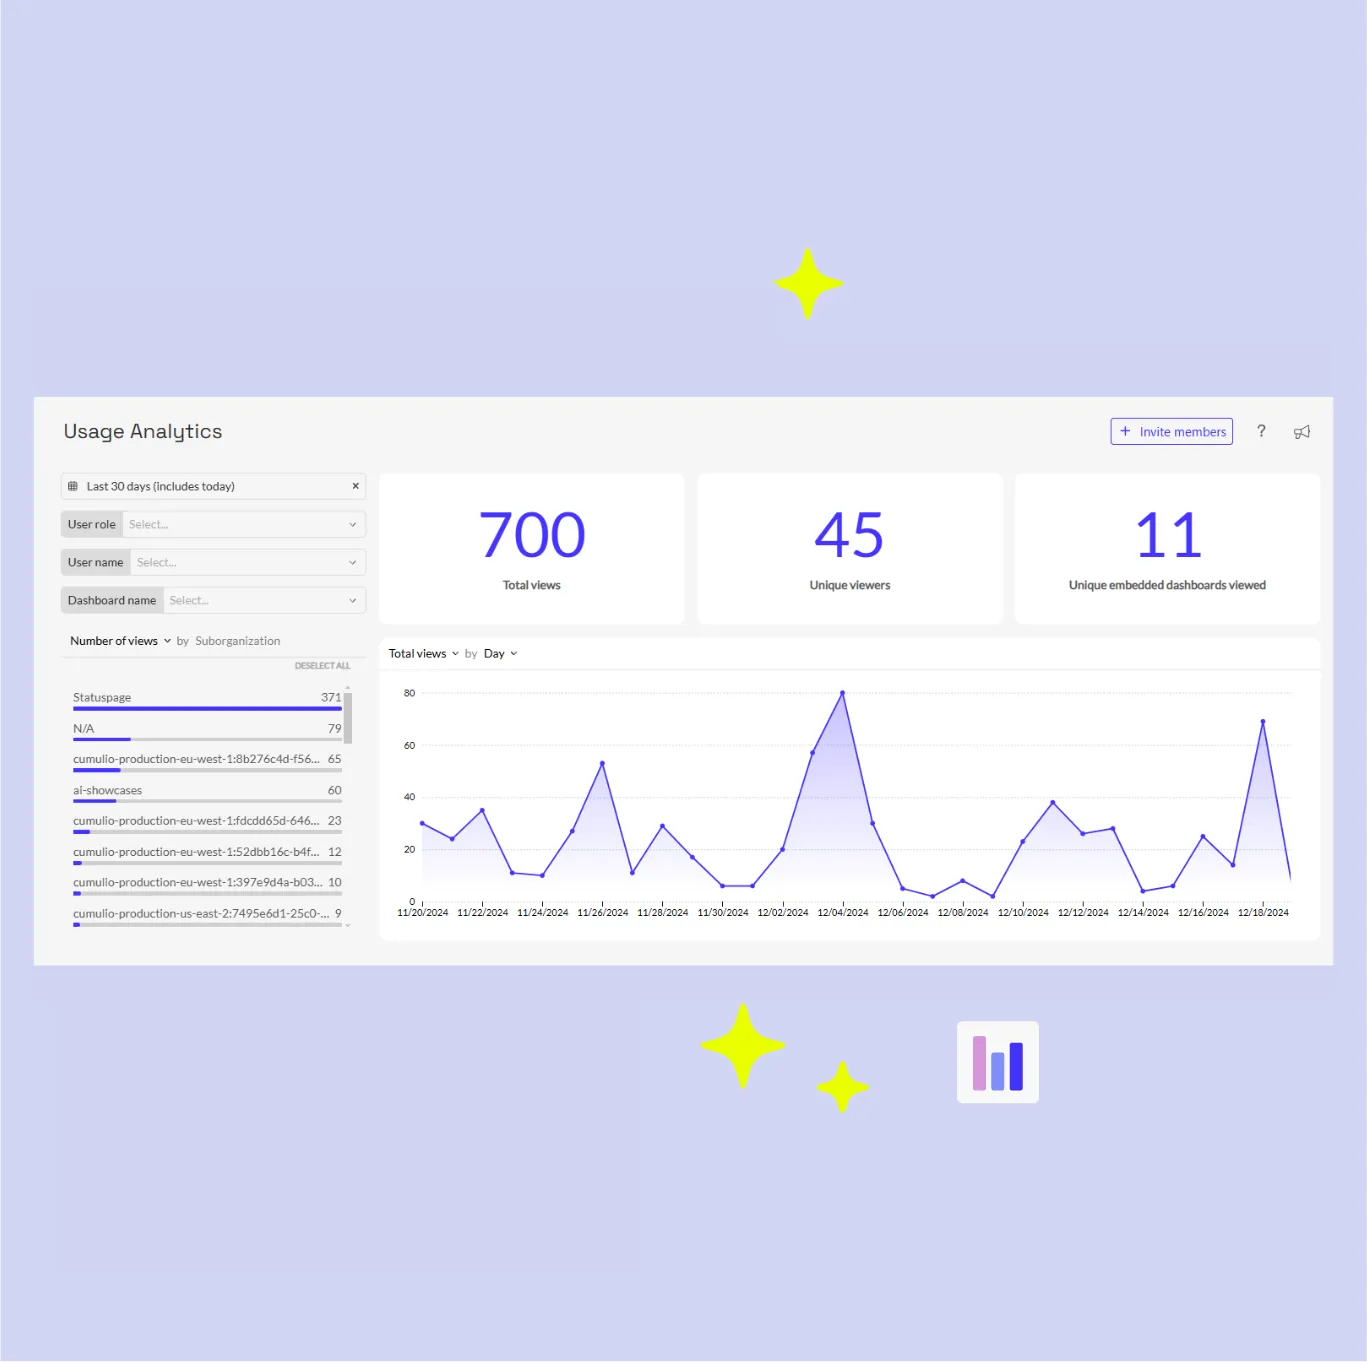
When usability is prioritized, data storytelling becomes a collaborative effort, empowering cross-functional teams to leverage data for informed decisions. Features like drag-and-drop dashboards, natural language queries, and automated insights eliminate barriers, fostering productivity without requiring extensive training.
Vendor assessment
Choosing the right vendor goes beyond comparing feature lists. It is about aligning with a partner who understands your business needs and provides consistent support. Start by researching the vendor's track record in delivering data analytics platforms to companies in your industry or of similar scale. Customer reviews and case studies offer insight into real-world performance, reliability, and scalability.
Examine the vendor's commitment to data integration and data management, ensuring their platform can handle various sources and deliver meaningful insights. Look for training programs, comprehensive documentation, and responsive customer support. These elements are crucial for a smooth onboarding experience and long-term success.
Engage with the vendor's team directly during the evaluation phase. Assess their willingness to adapt solutions to your challenges, and how effectively they address concerns about data governance, compliance, and scalability. A vendor that proactively demonstrates value is more likely to become a trusted partner rather than just a tool provider.
Buy-in from stakeholders
Communicate how the platform aligns with organizational goals, and tailor the message to the audience: C-suite stakeholders prioritize ROI and business growth, while technical teams focus on usability and integration effort. Involve stakeholders early, during trials and vendor demos, so the platform is assessed against the needs of the people who will live with it. When stakeholders are part of the decision, they advocate for the rollout rather than tolerating it.
Data integration
An effective platform does not operate in isolation. It integrates with your existing tech stack, and data integration is critical for creating a unified, actionable view of your operations. Whether you are pulling data from on-premises databases, hybrid cloud environments, or CRMs, the platform should harmonize data from diverse systems.

Choose a solution that automates data collection, preparation, and cleansing, so data teams can focus on higher-value analysis. Robust data management capabilities produce clean, consolidated datasets, which are crucial for driving valuable insights and reliable predictions.
AI capabilities
Modern analytics platforms thrive on AI-powered features. Machine learning, predictive analytics, and natural language queries do not just process data. They turn it into insights that drive smarter, faster decisions.
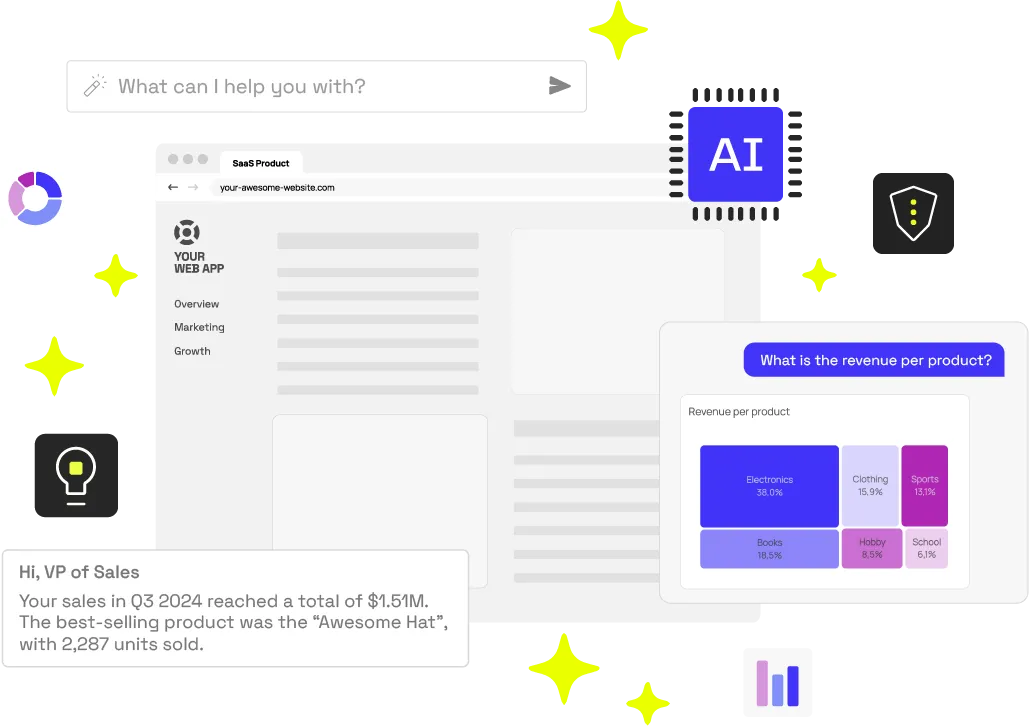
Luzmo IQ, for example, enables teams to spot trends, visualize data with clarity, and make proactive calls using real-time and historical data. By simplifying complex analysis, it helps businesses stay ahead without the guesswork.
Security and compliance
Robust data governance is not just about protecting sensitive information. It is about maintaining trust with customers, stakeholders, and regulators. An ideal platform adheres to industry standards like GDPR, SOC 2, and HIPAA, keeping data secure and compliant with legal frameworks.
Key features to look for include role-based access control, encryption, and audit trails to monitor data usage. Business intelligence solutions that prioritize security help mitigate risks, reduce exposure to breaches, and build confidence across the organization.
Cost vs. ROI
The financial investment in a platform should be weighed against its tangible impact. Beyond upfront costs, consider the time savings, productivity gains, and improved decision-making the platform delivers. A well-chosen data analytics platform optimizes workflows, reduces reliance on manual data preparation, and enables business growth through smarter strategies.
Focus on platforms that offer transparent pricing structures and measurable outcomes. Tools that enable rapid scaling, robust data visualization, and streamlined integration deliver value far exceeding their initial cost, ensuring a solid return on investment and month-over-month growth over time.
Requirements for data-intensive products
The considerations above apply to any analytics purchase. The four below only matter when your customers are the users, and they are where evaluations most often go wrong, because they are invisible in a demo with sample data.
Per-tenant isolation, not per-user permissions
Internal BI asks who in your company can see a dashboard. Customer-facing analytics asks something harder: can tenant A ever, under any condition, see a row belonging to tenant B. That includes cached results, exported files, error messages and shared query plans.
What to require: row-level security enforced at the data layer rather than the presentation layer, tenant identity carried in a signed token rather than a client-side parameter, and a documented answer to what happens when a token is tampered with.
How to test it during evaluation: ask the vendor to demonstrate a failed authorization. Anyone can demo the happy path. What you need to see is the error state.
Query load at concurrency, not at rest
Dashboards that respond in 400ms with one user often take 12 seconds with 200. The failure is rarely the platform. It is that every tenant hitting the same underlying tables produces a query pattern nobody modelled.
What to require: caching that is tenant-aware, so one customer's warm cache does not serve another's data and does not get invalidated by their write. Query result reuse across tenants where the data genuinely is shared. A concurrency figure the vendor will put in writing.
What to ask: what happens at your 95th percentile tenant, not your average one. Averages hide the customer with 40 times more rows than everyone else, and that customer is usually your largest account.
Cardinality and the shape of your data
Aggregate performance is a function of distinct values, not row count. A hundred million rows across twelve categories behaves nothing like a hundred million rows across four million customer IDs.
What to require: test with a copy of your real data at your real cardinality, not a sample. Most evaluations that go badly after signature went well during a trial run on 10,000 clean rows.
Cost that scales with tenants, not seats
Per-seat pricing is designed for internal deployments where seats are employees. When the seats are your customers, a pricing model that made sense at 50 tenants can become your largest infrastructure line at 500.
What to require: model the cost at three times your current tenant count before signing. Ask specifically what happens to the bill when a single tenant's data volume grows tenfold, which is what happens when one customer succeeds.
Build versus buy
Building this yourself is a reasonable decision, and it is more expensive than it looks, because the parts above are the expensive parts. Charting libraries are cheap. Tenant isolation, cache invalidation, concurrency and the on-call rotation that comes with them are not, and they never stop needing maintenance.
The honest test: if customer-facing analytics is a differentiator you sell against, build it. If it is a requirement your customers expect and nobody chooses you for, buy it. Most teams discover which one they have about six months after committing to the other.
Our build vs buy checklist walks through the same decision with the cost lines laid out side by side.
ROI Calculator: What's the real value of your platform?
You can calculate the Return on Investment (ROI) of an analytics platform using the following steps:
1. Annual productivity savings
How much time have you saved (or do you hope to save) by using an analytics platform? For example, how much time did your engineers spend on developing charts and deploying them inside your web application, versus now?
Once you've identified time savings, identify how much those resources cost you. For example, what's the hourly rate or salary of said developer? Multiply the hours saved per month by the hourly rate, then multiply by 12 (months in a year):
Annual Productivity Savings = Hours Saved Per Month × Hourly Rate × 12
2. Annual revenue increase
Let's say you're using an analytics platform to make insights available to your customers. How much are these customers paying to access these insights (or would they be willing to pay)? Multiply the monthly revenue increase by 12:
Annual Revenue Increase = Monthly Revenue Increase × 12
3. Annual cost savings
Are there any additional cost savings from automation or streamlined processes? For example, are there any tools or services you no longer need to pay for thanks to using a new analytics platform? Add those cost savings here.
Annual Cost Savings = Additional Savings
4. Total ROI
Add all the above components together:
ROI = Annual Productivity Savings + Annual Revenue Increase + Annual Cost Savings
Example calculation
Let's assume the following values:
- Hours saved per month = 20
- Hourly rate = $50
- Monthly revenue increase = $10,000
- Annual cost savings = $5,000
Now, calculate each part:
- Annual Productivity Savings = 20 × 50 × 12 = $12,000
- Annual Revenue Increase = 10,000 × 12 = $120,000
- Annual Cost Savings = $5,000
Total ROI = 12,000 + 120,000 + 5,000 = $137,000
Thinking of building analytics for your software platform, but afraid of the costs? Simulate your potential ROI in our calculator below!
Feature prioritization: What matters most to your team?
When choosing an analytics platform, endless features make it easy to get overwhelmed. The key is aligning platform capabilities with your team's needs and priorities. A structured approach helps you focus on what truly matters for your business goals while avoiding shiny features that may not add value.
Feature Prioritization Scorecard
Use the following framework to categorize features based on their importance to your team. This will help you evaluate platforms effectively:
Essential
Definition: Features your team absolutely requires to meet goals and improve workflows.
Examples:
- Row-level security enforced at the data layer, with tenant identity carried in a signed token.
- White-labeling, so dashboards carry your product's branding rather than the vendor's.
- Seamless integration with existing tools like CRMs or data warehouses.
- Robust security and compliance (e.g., GDPR, SOC 2).
- Interactive and user-friendly data visualization tools.
Nice-to-Have
Definition: Features that enhance functionality but aren't mission-critical.
Examples:
- Predictive analytics and forecasting.
- Advanced collaboration tools.
- AI-powered natural language queries for easier user interaction.
Not Important
Definition: Features that don't directly align with your business needs.
Examples:
- Overly specific integrations your organization won't use.
- Features tailored for industries outside your domain.
Example scenario
Imagine you are shipping analytics to customers inside your product, with a product owner, a designer, and a group of engineers on the evaluation:
- Essential: white-labeling, because the dashboards sit inside your product and your customers should never see another vendor's brand. This is the correction most internal-BI checklists get wrong.
- Nice-to-Have: predictive analytics may deepen the experience, but customers are not churning over the absence of a forecast.
- Not Important: niche features designed for supply chain analytics may not be relevant for a software company.
How to use this scorecard
- Gather input: involve stakeholders from all relevant teams (e.g., product, engineering, support) to understand their priorities.
- Categorize features: assign features to one of the three categories: Essential, Nice-to-Have, or Not Important.
- Align priorities: use the scorecard to ensure your team is aligned when evaluating platforms.
Get your ultimate scorecard for free here.
Why product teams choose Luzmo
Adjectives are cheap in this category. Here is what five customers actually got, with the case studies behind each one.
- Analytics shipped in weeks instead of years. Lansweeper needed analytics capabilities its engineering team had not been hired to build. As their team put it, Luzmo let them "leapfrog our capabilities in a matter of weeks to where we would have otherwise spent years getting there."
- 80% fewer custom report requests. Spaceflow was pulling manual reports for product users. After embedding a refreshed dashboard experience with Luzmo, requests for custom data reports dropped by as much as 80%.
- Analytics as a revenue line, not a cost line. InTouch replaced a decade of Jaspersoft tech debt after a two-month head-to-head trial. Their analytics module is now a structural upsell path, converting roughly 15 to 25% of standard accounts to higher tiers within six months of launch.
- It wins technical evaluations. Two senior engineers at Attuned Education Partners assessed eight BI tools and hands-on tested three before choosing Luzmo, then shipped enterprise-grade embedded dashboards for a marquee K-12 client on a compressed timeline.
- Client-facing teams build their own dashboards. At Greenly, the feedback loop between a dashboard idea and production was too long when only engineers could build. Giving climate experts the ability to create the dashboards their clients needed put the work in front of the person who understood the problem.
More of these live in our customer stories, and the full landscape is covered in our guide to embedded business intelligence.
Conclusion
An internal BI evaluation and an embedded analytics evaluation look similar on a feature list and diverge completely in production. The requirements that decide it, tenant isolation, behaviour at concurrency, the shape of your data, and pricing that tracks tenants rather than seats, are the ones a demo with sample data will never show you.
Run the scorecard, run the ROI model, and ask every vendor to demonstrate a failed authorization. The answers will separate the shortlist faster than any feature comparison.
Ready to take the next step? Explore Luzmo and see how it fits your product.
FAQ
All your questions answered.
What are the requirements for embedded analytics?
At minimum: row-level security enforced at the data layer, tenant identity carried in a signed token, white-labeling, a documented concurrency figure, and pricing modelled against tenant count rather than seats. Feature checklists matter less than these, because features are visible in a demo and these are not.
What is multi-tenant analytics?
Analytics where one deployment serves many customers, each seeing only their own data. The distinguishing requirement is isolation: no tenant can reach another's rows through the interface, the cache, an export, or an error message.
Should we build or buy embedded analytics?
Build if customer-facing analytics is a differentiator you actively sell against. Buy if it is an expectation your customers have but nobody chooses you for. The cost of building sits in tenant isolation, caching and concurrency rather than in charts.
What is the difference between embedded analytics and business intelligence?
BI serves people inside your company making internal decisions. Embedded analytics serves your customers inside your product. The technical consequence is that embedded analytics has requirements around isolation, concurrency and branding that internal BI does not.
How do you calculate ROI on an analytics platform?
Add annual productivity savings, annual revenue increase from analytics your customers pay for, and annual cost savings from tools you retire. Multiply hours saved per month by the hourly rate and by 12, add monthly revenue increase multiplied by 12, then add the tools you no longer pay for.
Written by

Ship the future of your data
Let us show you what Luzmo can do for your product.

Book your session with our analytics expert.