How 4 Companies Saved Development Time With Embedded Analytics
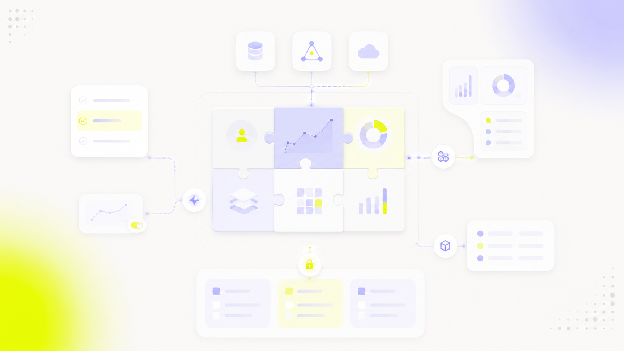
Reporting rarely looks like the biggest item on a product roadmap. Then customers start asking for new dashboards, custom metrics and better ways to explore their data.
What seemed like one reporting feature becomes a recurring engineering commitment. Every new chart needs product input, development time, testing and maintenance. Customer success teams keep collecting requests while engineers are pulled away from the product features that first brought customers in.
Lansweeper, Timewax, Hult EF and Field & Concept faced different versions of that problem. Each used embedded analytics to remove a specific bottleneck, from avoiding years of development to cutting the preparation behind recurring customer reports.
Their stories show that saving time with embedded analytics does not mean doing the same work slightly faster. It often means removing whole categories of work from the development queue.
Four companies, four analytics bottlenecks
| Company | Analytics challenge | What changed |
|---|---|---|
| Lansweeper | A long roadmap for advanced reporting and data visualization | The company skipped an estimated three years of development |
| Timewax | A reporting module that had to scale across customers | The team implemented Luzmo in two months |
| Hult EF | New data requests required engineering planning | Product teams could add data without creating a new sprint |
| Field & Concept | Manual analysis slowed customer reporting | Its first embedded dashboards went live in one month |
Lansweeper skipped three years of analytics development
Lansweeper helps organizations understand and manage their technology assets. Its platform already handled data collection and preparation, but customers wanted a better way to analyze that data.
The reporting roadmap had grown long. Building the required visualization and exploration experience internally would have placed more work on an engineering team whose main expertise was not business intelligence software.
Lansweeper decided that continuing to build every analytics capability in-house would cost more than development hours alone. It would also delay improvements customers were already asking for.
Embedding Luzmo allowed the company to move directly to a more complete analytics experience. Customers gained smoother navigation, interactive analysis and the ability to explore data without asking support for help.
"With Luzmo, we skipped three years of development time and immediately jumped to a full-blown BI solution."
Maarten Saeys, CPO at Lansweeper
The time saving went beyond the first release. Luzmo took responsibility for the underlying dashboard and visualization technology, so Lansweeper's engineers could focus on the parts of the product unique to Lansweeper.
The company also started embedding insights closer to the moment users needed them. Instead of sending every user to a separate dashboard area, visualizations could appear on asset pages and troubleshooting screens.

That matters because the hidden cost of building analytics in-house is not limited to building a reporting module once. The team must keep improving it as user expectations, data volumes and product workflows change.
Read the full Lansweeper case study →
Timewax launched a scalable reporting module in two months
Timewax provides project and resource management software for project-based companies. Its users wanted dashboards answering practical questions about project profitability, budgets and resource utilization.
The request was valuable, but reporting was not the core reason Timewax existed. Building a complete analytics layer from scratch would have required the company to invest engineering time in infrastructure, dashboard management, permissions and customer-specific data access.
An early prototype built with Google Data Studio exposed another problem. Timewax would have needed to create separate datasets and dashboards for individual customers. That model did not fit a one-to-many SaaS product.
Timewax needed one reporting setup that could serve many customers while respecting the permissions already managed inside its platform.
The team implemented Luzmo in two months, considerably faster than its internal estimate for building the module itself. Much of that period was spent preparing the data model rather than developing charting and dashboard infrastructure.
Timewax could then offer different analytics experiences across its pricing tiers. Customers on one tier received a standard set of dashboards, while premium users gained more room to customize their reports.
The impact continued after launch. Product managers could work directly on dashboards and respond to analytics requests without routinely taking developer capacity. Engineering remained focused on the central Timewax feature set.

Read the full Timewax case study →
Hult EF stopped creating a sprint for every reporting update
Hult Ashridge had relied on in-house reporting and analytics for years. As its digital learning products expanded, the team had to work with new datasets and new categories of information under strict timelines.
The reporting system could provide data, but it was difficult to adapt. When a customer or internal team needed a data point that was not already available, the request could require a new engineering sprint.
This made small reporting changes disproportionately expensive. Adding one metric was not merely a dashboard edit. It became roadmap work.
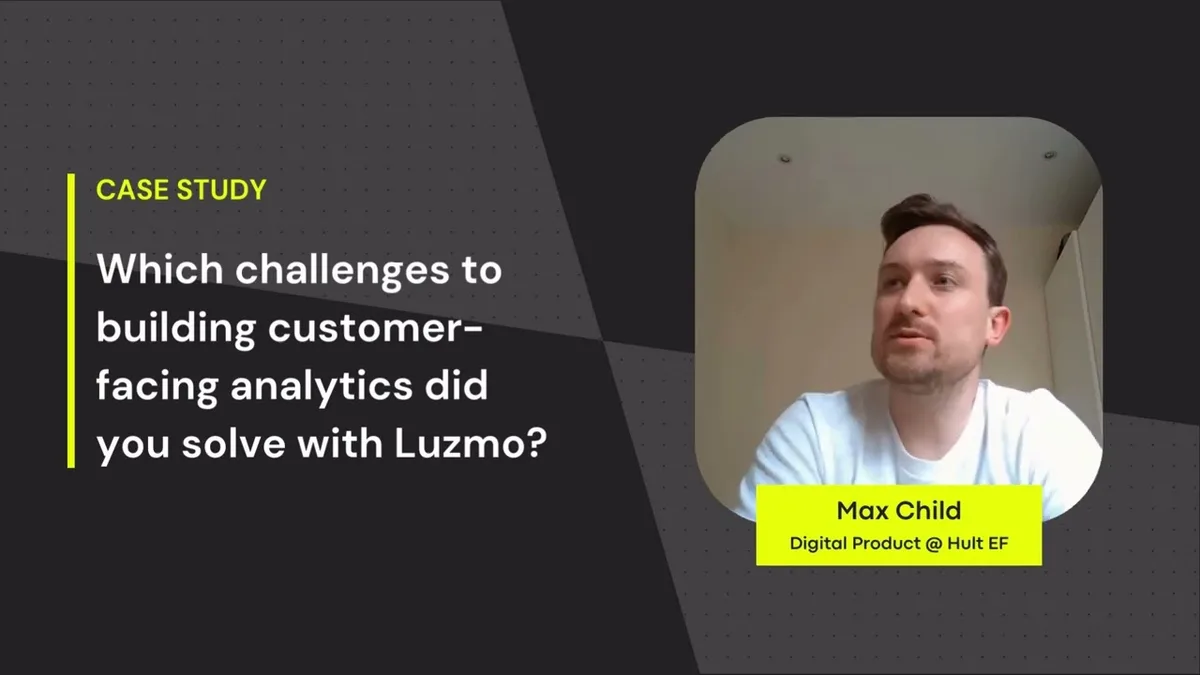
With Luzmo, Hult EF's digital product team could connect new datasets, add charts and update information without reopening the engineering process each time. The dashboards remained embedded in Hult EF's product interface and continued using its existing permission setup.
"Previously, when someone was looking for a data point they couldn't get, we'd have to create a whole sprint plan to get that piece of information on a dashboard. Now, we can easily pull that data point ourselves and deliver insights to our clients or internal teams quicker."
Max Child, Digital Product Support at Hult Ashridge
One year after onboarding, Hult Ashridge had six core dashboards live in its platform. They covered data such as learning hours, course engagement, program scores and NPS.
The larger saving came from changing who could act on reporting requests. Product team members could make updates themselves instead of treating every new requirement as an engineering project.
Read the full Hult EF case study →
Field & Concept put its first customer dashboards live in one month
Field & Concept runs field marketing and brand activation programs. Its internal tools generated data about sales, budgets, field teams and campaign activity, but turning those datasets into useful customer reports required manual analysis.
Customers could access their data, and Field & Concept held regular business reviews with them. The problem was speed. Monthly or quarterly reviews delayed action, while preparing the reports created additional work for the team.
Field & Concept considered programming custom dashboards because much of its technology had already been developed internally. It chose to integrate an existing analytics platform instead.
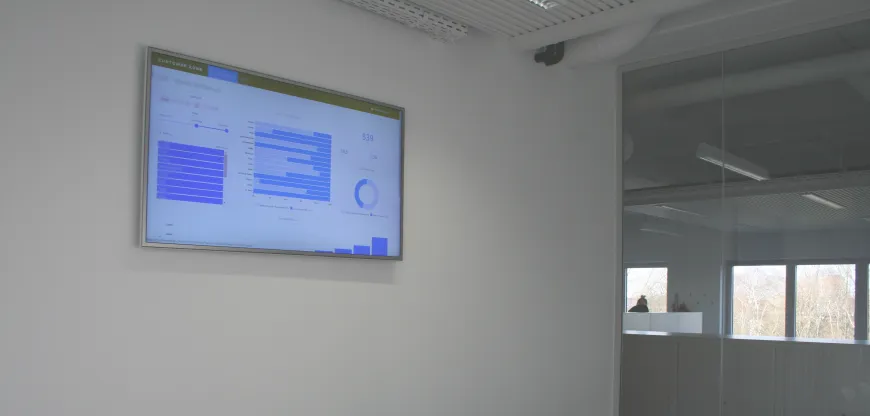
Within one month, the company had its first dashboards running inside its customer zone. The initial version used Excel and CSV exports. It later connected Field & Concept's internal tools so data captured by employees in the field could flow into the dashboards automatically.
Customers could then follow campaign activity and budget pacing closer to real time. Internally, business reviews required less preparation because the dashboard already handled a large part of the analysis.
This example shows a different kind of time saving. Embedded analytics did not only accelerate software delivery. It shortened the recurring work surrounding every customer relationship.
Read the full Field & Concept case study →
The biggest saving is not always the initial build
These companies did not start with the same problem.
Lansweeper faced years of potential analytics development. Timewax needed a reporting module that could scale across its SaaS customer base. Hult EF wanted to stop turning small data requests into engineering sprints. Field & Concept needed to reduce the manual work around customer-facing analytics.
The common thread was not simply that embedded analytics made dashboard development faster. It changed the operating model behind analytics.
Work moved away from a permanent engineering queue. Product managers gained more control over dashboards. Customer-facing teams could respond to reporting needs without waiting for a custom build. Improvements could be shipped without recreating the underlying analytics infrastructure.
That distinction matters when comparing an embedded analytics platform with an in-house build. The useful calculation is not:
How long will it take us to build the first dashboard?
It is:
How much product, engineering and customer success time will reporting require over the next several years?
Building the first dashboard
- Charts
- Filters
- Layout
- Data connection
Running analytics as a product capability
- Permissions
- Multi-tenant delivery
- New data requests
- Dashboard editing
- Performance
- Maintenance
- Customer customization
What product teams can learn from these examples
Before assigning another reporting request to engineering, separate the visible feature from the system required to support it.
A customer may ask for one dashboard, but the product team will eventually need to answer broader questions:
- Who can create or edit dashboards?
- Can one setup serve multiple customers securely?
- How quickly can the team add a new metric?
- Can reporting match the rest of the product?
- What happens when customers request more control?
- Who maintains the analytics layer after launch?
Building internally can still make sense when analytics is the product's core intellectual property or the required experience cannot be supported through an external platform. If that is your situation, it is worth working through a structured build vs buy comparison first.
For many SaaS teams, however, the real choice is not between paying for software and building a few charts. It is between using a maintained embedded analytics layer and becoming responsible for an expanding BI product inside the existing product.
Lansweeper, Timewax, Hult EF and Field & Concept chose to keep their teams focused on the product value only they could build.
FAQ
All your questions answered.
How does embedded analytics save development time?
Embedded analytics provides maintained components for dashboards, visualizations, permissions and customer-facing delivery. Product teams can add reporting without developing the complete analytics layer internally, then continue updating dashboards without routing every change through engineering.
Is embedded analytics faster than building dashboards in-house?
It can be, particularly when the product needs multi-tenant delivery, interactive filtering, permissions or self-service reporting. Timewax implemented its reporting module in two months, while Lansweeper estimated that continuing its internal roadmap would require years of development.
Does embedded analytics remove developers from the process?
No. Developers usually handle the initial integration, data access, authentication and product-level customization. The difference is that product or data teams can often manage routine dashboard work without requiring engineering support for every update.
When should a company build analytics in-house?
An in-house build may suit products where analytics is the core product, the interface requires highly specialized behavior or the company has a dedicated visualization team. The decision should include long-term maintenance and new customer requests, not only the first release.
Written by

Ship the future of your data
Let us show you what Luzmo can do for your product.

Book your session with our analytics expert.