What is a Data Science Pipeline and How to Use It?
Did you know that dozens of different operations happen with datasets before you can create something as simple as a graph? Behind the scenes, data preparation, data integration, validation, and more happen so you have clean data that can be turned into insights you can understand.
This all starts with something called a data science pipeline. Today, we’ll explain what it is, why it’s important, and what makes it different from similar terms in data engineering.
What is a data science pipeline?
A data science pipeline is a series of processes that data scientists collect, process, analyze, visualize, and interpret data and derive insights from it. It’s a structured process that helps them go from raw data to information someone else can use for decision-making.
Having a well-established data science pipeline workflow makes sure that data projects are consistent, efficient, and scalable.
How does a data science pipeline work?
Your specific data science pipeline will depend on your business requirements and the complexity of your data science projects. However, most of them have similar steps.
- Data collection
Data is collected from various sources, including data warehouses, APIs, business tools, or web scraping apps. When scraping location-specific content, the best residential proxies or mobile proxies can help ensure accurate, geo-targeted data collection while avoiding IP bans.
- Data cleaning
Incomplete, irrelevant, and unstructured data is cleaned and formatted properly so there are no issues with processes like exploratory data analysis later on. Missing values are added to unstructured data.
- Data transformation
Data is transformed into a format that is suitable for analysis later on. At this point, data goes through normalization, aggregation, or encoding categorical variables.
- Data exploration
Data distributions and relationships are explored, typically through data visualization such as graphs, dashboards, and reports. This allows even end users who are not familiar with data analytics to understand the relationships between data points.
At this stage, modern analytics platforms can help teams explore and understand data much faster. With Luzmo Studio, product teams can build dashboards and visualizations directly from their datasets and embed them inside their applications. Luzmo IQ can automatically surface trends, anomalies, and correlations across the data, while Luzmo AI allows users to ask questions in natural language and generate insights or charts instantly from their datasets.
- Feature engineering
New variables are created or existing ones are modified to improve the performance of the model and get essential information.
- Modeling
Machine learning algorithms are selected and trained to make predictions or classify data.
- Evaluating
Assessing how accurate the model is and how it performs based on metrics such as precision, recall, or F1 score.
- Deployment
The model is deployed in a real-life production environment where it can be used across apps and different platforms in various use cases.
- Monitoring and maintenance
The model performance is tracked continuously so you can make adjustments and ensure it stays accurate over time.
Through the automation and optimization of these processes, data-driven companies can speed up the time it takes to go from raw data to actionable insights.
Data science pipeline vs. ETL pipeline
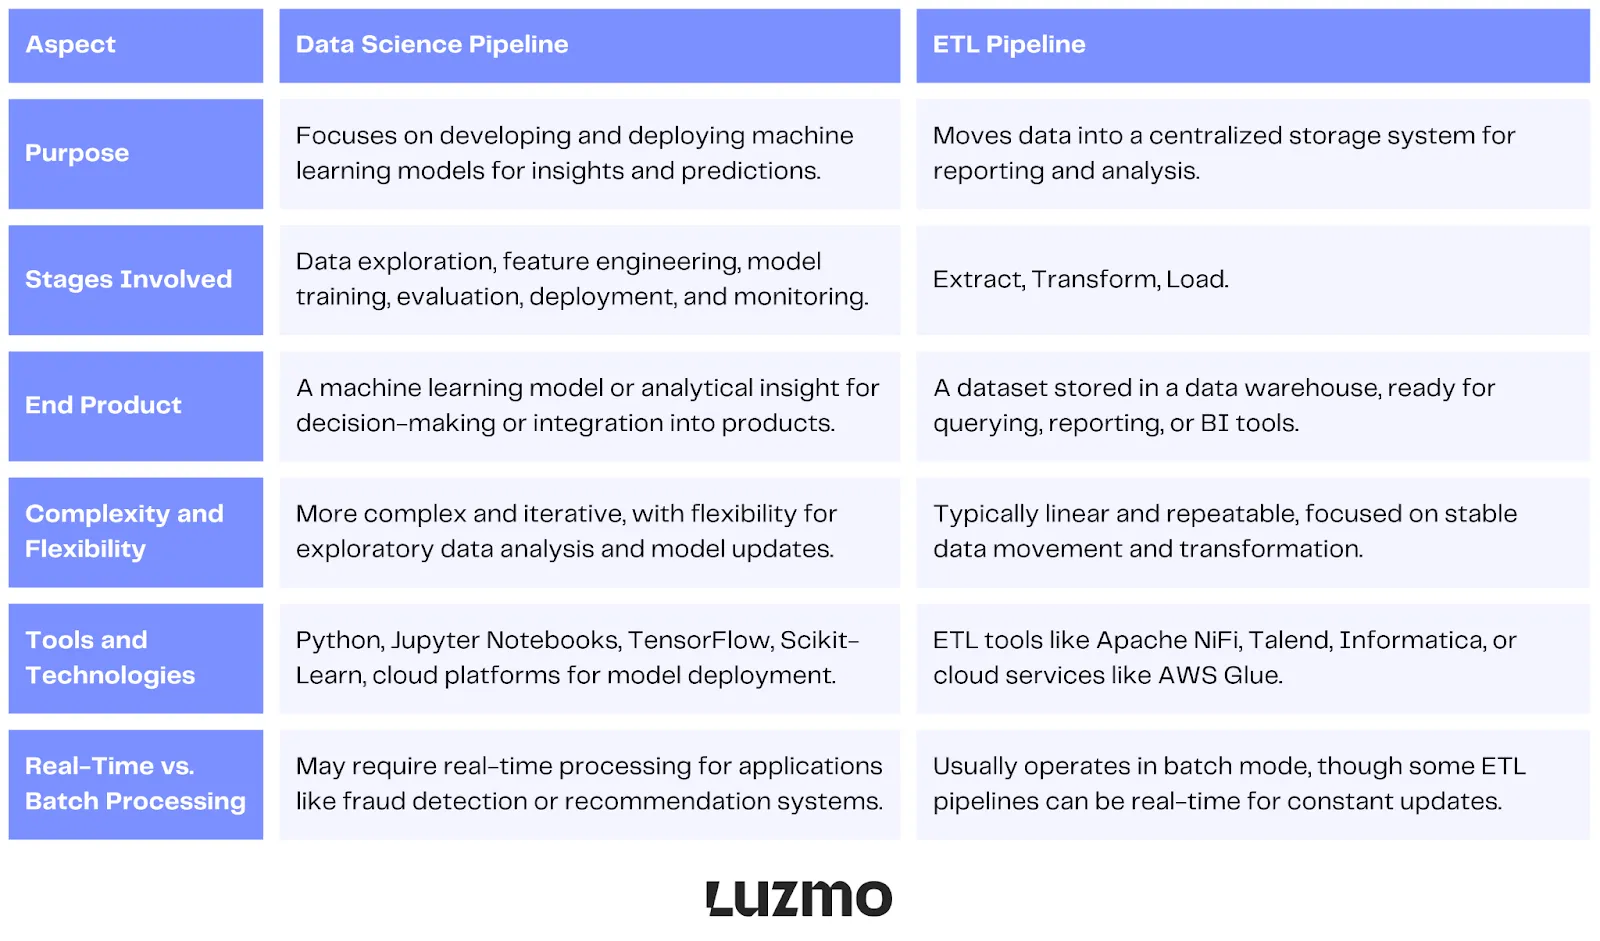
A data science pipeline and an ETL (extract, transform, load) pipeline revolve around data processing but have different purposes, structures, and stages.
Purpose
Data science pipeline focuses on the entire process of developing and deploying machine learning models, from collecting data from various data sources, cleaning and evaluating it.
ETL pipelines are concerned with moving data from source systems to a centralized data storage system such as a data lake or a data warehouse, for analysis or reporting.
Stages involved
A data science pipeline typically consists of nine different stages, as outlined above. Data exploration, feature engineering, and others. It’s specifically designed to support the machine learning and data science lifecycle.
The stages involved in ETL are fairly simple: Extract, Transform, and Load.
End product
The end product of a data science pipeline is a machine learning model or analytical insight that can be used for decision making or integrated into a product.
The end product of an ETL pipeline is a dataset, usually stored in a data warehouse, ready for querying, exporting, analysis, visualization, and interpretation.
Complexity and flexibility
A data science pipeline is typically more complex because of the iterative nature of machine learning models. It’s also more flexible to accommodate the different needs of data analysts and to adapt to changes of models or data sources.
ETL pipelines are straightforward and more linear, focusing on moving and transforming data without requiring iterative processes.
Tools and technologies
Tools commonly used for creating a data science pipeline include Python, TensorFlow, Scikit-Learn, Jupyter Notebooks, and cloud platforms for deploying models, such as AWS Sagemaker.
ETL processes typically use ETL tools such as Talend, Apache NiFi, Informatica or cloud services such as AWS Glue. In the end, data is stored in warehouses such as Google BigQuery or Amazon Redshift.
Real-time vs. batch processing
Data science pipelines require real-time data processing, especially in industries where time is of the essence, such as fraud detection in finance.
ETL pipelines usually function in batch processing mode, where large amounts of data are moved at intervals, such as hourly or daily. However, some ETL pipelines also function in real time.
Benefits of data science pipelines
Data science pipelines have significant benefits for anyone in data analytics and engineering, and eventually for the end-users using tools such as artificial intelligence and natural language processing to explore data on their terms. Here are a few more upsides of data science pipelines.
Efficiency and automation: time-consuming and repetitive tasks can be automated, which allows data scientists to focus on more complex analyses. Once a clear workflow is established, new data can get through the pipeline more easily, eliminating the need for intervention.
Consistency and reproducibility: pipelines enforce a standardized approach to data processing and data modeling, which ensures that the same procedures are applied to all types of data. And when each step is properly documented and automated, it can be reproduced without fear of error.
Scalability: data science pipelines can handle large volumes of data, which supports end-to-end data analytics needs as your organization grows. They can also be modified and adapted to include new data sources, models, or analytics technologies.
Error reduction and quality assurance: pipelines reduce manual intervention, which in turn minimizes chances for error. The data quality is consistently high, which is crucial for accurate data modeling and relevant insights.
Easier collaboration: a data science pipeline that is defined well can be understood by multiple team members, making it easier to work in real-time as well as onboard new team members.
Faster deployment and iteration: deploying models and regularly updating them becomes easier with a good data science pipeline. You also introduce a continuous cycle of monitoring, evaluation and retraining, which makes sure that models are constantly updated and improved.
How data science pipelines are used for data analysis in different industries
Data science pipelines can be used across different industries, with various sources of data and end goals.
In healthcare: for predictive analytics, to analyze patient data, medical histories, and real-time data monitoring to predict patient outcomes, prevent readmissions, and improve treatment plans.
In finance: for fraud detection, risk assessment, and algorithmic trading. You can use data science pipelines to identify patterns in real time and spot fraud attempts, and potential risks and execute trades based on market trends.
In retail and e-commerce: to segment customers based on purchase behavior, do inventory management based on historical trends, and implement recommendation systems by analyzing user interactions and preferences.
In manufacturing: to do preventative maintenance based on historical records, to do quality control for defects and inefficiencies, as well as optimize your supply chain based on demand forecasts and past performance.
Where the data science pipeline connects to embedded analytics
A data science pipeline typically ends with a deployed model — a score, a prediction, a classification — that runs in production. For many teams, that is where the pipeline documentation ends. But the deployment stage is not the final step; the final step is surfacing the model output to the person who needs to act on it, in the context where they make that decision.
This is where embedded analytics becomes part of the data science pipeline rather than a separate concern. A churn prediction model deployed to production is only valuable if a customer success manager can see which accounts are at risk before they cancel. A demand forecasting model is only valuable if a supply chain manager can see the forecast in the tool where they plan procurement. The model output needs to be embedded where the decision happens.
The practical implication for data pipeline design is that the output layer — how model scores and predictions are exposed to end users — should be planned as part of the pipeline architecture, not added as an afterthought. This means deciding early whether model outputs will be stored in the data warehouse alongside operational data, how they will be joined to the dimensions users care about (account, product, region), and which analytics platform will surface them in the product.
For software teams that use Luzmo for embedded analytics, model outputs stored in a connected data source can be visualized alongside standard KPIs in the same dashboard. Luzmo AI can surface these predictions conversationally — a user who asks "which of my accounts are most at risk this month?" receives an answer derived from the underlying model output, without needing to know that a model produced it.
Data science pipeline best practices: what separates reliable pipelines from fragile ones
Most data science pipelines work well in development. The challenges that distinguish experienced teams from beginners show up in production, where real data arrives in ways that the training data did not anticipate.
Version control for data and models, not just code, is the first practice that separates reliable pipelines from fragile ones. A model that performs well on the training dataset can degrade silently when the distribution of incoming data shifts. Tracking model versions alongside the data they were trained on, and monitoring prediction distributions in production, allows teams to detect this degradation before it affects business outcomes.
Data validation at ingestion is the second. Pipelines that assume input data will always conform to the expected schema will eventually fail when a source changes a column name, shifts a data type, or starts sending nulls where values were previously guaranteed. Building validation steps into the ingestion layer that reject or flag non-conforming data — rather than passing it through to corrupt downstream models — prevents a class of silent failures that are hard to debug after the fact.
Separation of feature engineering from model training is the third. When feature computation is coupled directly to the training code, the same computation needs to be replicated for serving. Discrepancies between training and serving feature computation — a common source of model degradation — are avoided by centralizing feature definitions in a feature store or a shared transformation layer that both training and serving reference.
Documentation of model assumptions and limitations is the fourth, and the one most often skipped under time pressure. A model that assumes stationarity in the input data will fail when that assumption breaks. Documenting what assumptions the model makes, what data conditions invalidate its outputs, and who is responsible for monitoring it in production makes the pipeline maintainable by people who did not build it.
Wrapping up
Data science pipelines are the foundation for accurate and timely data analysis. Once you’ve taken care of this crucial step, you can visualize and analyze your data, and this is where Luzmo comes in.
We specialize in helping software companies provide analytics capabilities to their end-users. They don’t need to be data scientists to analyze and visualize data. Simply add an embedded analytics dashboard to your platform and watch as your customers unlock the power of data in seconds.
Don’t take our word for it - grab a free demo and see how Luzmo fits into your data analytics strategy.
FAQ
All your questions answered.
What is the main purpose of a data science pipeline?
The main purpose of a data science pipeline is to create a structured workflow that transforms raw data into useful insights or machine learning models. By organizing tasks such as data collection, cleaning, transformation, modeling, and evaluation, pipelines ensure that data projects are efficient, scalable, and reproducible.
What tools are commonly used to build data science pipelines?
Data science pipelines are often built using tools such as Python, TensorFlow, Scikit-Learn, and Jupyter Notebooks for modeling and experimentation. Cloud platforms like AWS SageMaker are also commonly used for deploying machine learning models and managing data workflows.
What is the difference between a data science pipeline and an ETL pipeline?
A data science pipeline focuses on the full lifecycle of data analysis and machine learning, including modeling, evaluation, and deployment. An ETL pipeline, on the other hand, is designed mainly to extract, transform, and load data into a data warehouse where it can later be analyzed or visualized.
Written by

Ship the future of your data
Let us show you what Luzmo can do for your product.

Leave your e-mail and one of our analytics experts will reach out to you