Product Release Update – August 2026
This release is about getting more out of the dashboards you've already built. Five updates, all pointed at the same thing: more control, less rebuilding, less code.
Change a chart's type in place and keep your filters, title and theme. Write SQL with your live schema, column types and key relationships sitting next to the editor. Define options once and let a single custom chart adapt to every dashboard it lands on. Slice array columns with real precision. And set up a plugin in one step, with its capabilities spelled out.
Switch a chart's type without rebuilding it

This one has been at the top of the request list in Studio for a while, and for good reason. Chart type is a reversible decision: any chart on any dashboard can become a different type, in place, keeping the slots, options and filters you set up.
Now you just switch it. Open the Edit item panel, hit Switch item type, and pick the type you want. Before anything changes, a Data field mapping panel shows you field by field where everything lands. Turning a donut chart into a Sales leaderboard, for instance, you'd see Total amount excl. VAT going Measure → Revenue and Employee going Category → Sales Rep, with anything the new type can't hold marked Dropped in red. So you know what you're losing before you lose it, not after. Hit Switch type and the chart re-renders in place, with your filters, title, theme and matching options intact.
You get:
- A searchable type picker: every chart type in one dropdown, with a search field so you're not scrolling.
- A data field mapping preview: every field shown with its destination slot, and anything the new type can't hold flagged as dropped. Cancel if it isn't what you wanted.
- Everything else stays put: filters, title, theme, and any options that exist on both types.
- Custom Charts included: switch to and from your own custom chart types, not just the standard ones.
You'll find the button at the top of the Edit item panel in Studio, next to Copy to dashboard. Open a dashboard and try it on something you already built.
Write SQL with your schema right next to you
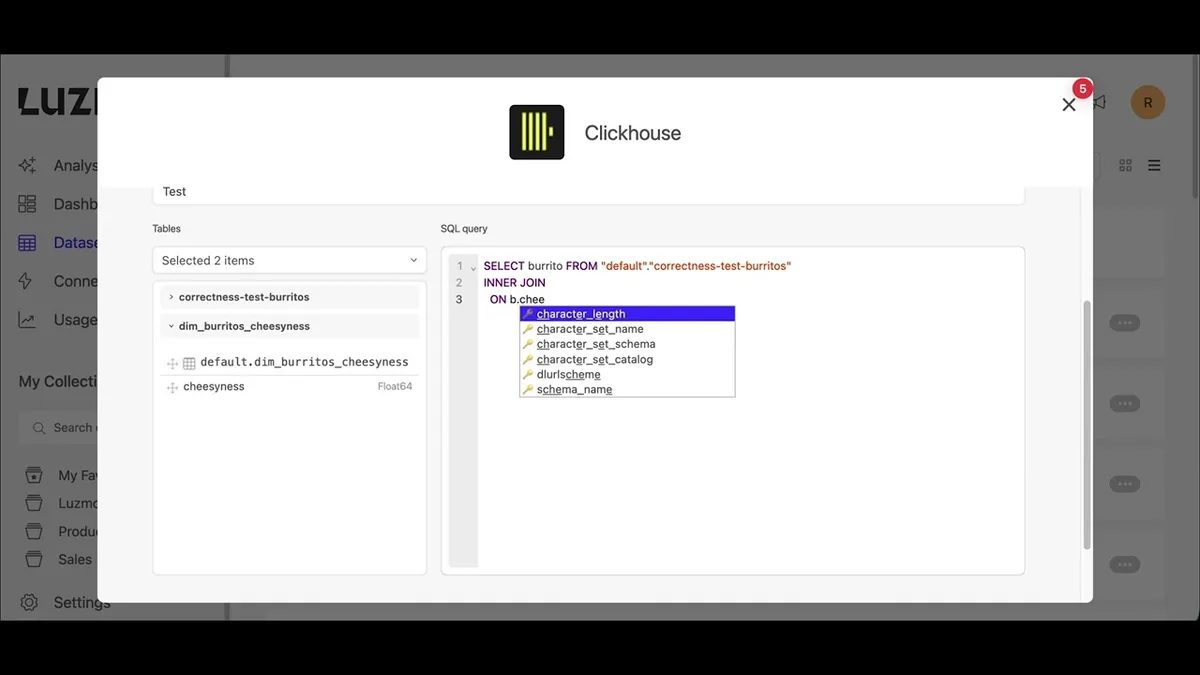
Writing a SQL dataset is a job you can now do with your schema in front of you: exact table names, column types, key relationships, and quoting that matches the engine you're querying.
The rich SQL editing experience we built for ClickHouse now runs across our SQL connectors. Both the New dataset and Edit query panels come with a live schema browser, a table picker, and schema-aware autocomplete, so you can see what you're querying while you query it.
You get:
- A live schema browser: pick tables from a multi-select and expand them in an accordion next to the editor.
- Columns, types and keys: each table shows its columns and data types plus primary and foreign key relationships, so you can see how tables join before writing a line.
- Real metadata, fetched live: pulled from the source without creating a dataset first, so what you see is the current schema, not a stale copy.
- Dialect-aware autocomplete: BigQuery, Snowflake, Postgres, MySQL and SQL Server each get completions and identifier quoting that actually run on that engine.
- Fully qualified names where they're needed:
project.dataset.tablefor BigQuery,DATABASE.SCHEMA.TABLEfor Snowflake, so every query is qualified the way that engine expects. Connectors with a default schema still take short names. - Drag and drop: drop tables and columns straight into the editor, quoted correctly for your engine (backticks, brackets or double quotes, depending).
- Clearer errors: malformed queries and missing or permission-limited tables surface a message that tells you what to fix.
The schema browser and schema-aware autocomplete are live across data warehouses (ClickHouse, BigQuery, Snowflake, Databricks), relational databases (PostgreSQL, Redshift, Panoply, PipelineDB, MySQL, MariaDB, SQL Server, Synapse) and query engines (Trino, DuckDB). SQL datasets themselves still work on Presto and Stardog too, with schema browsing coming to those as we build it. And if the connected account can't read constraint views, foreign key discovery degrades gracefully: you still get tables and columns.
→ Read the SQL datasets guide (opens in new tab)
Custom Charts now take configurable options
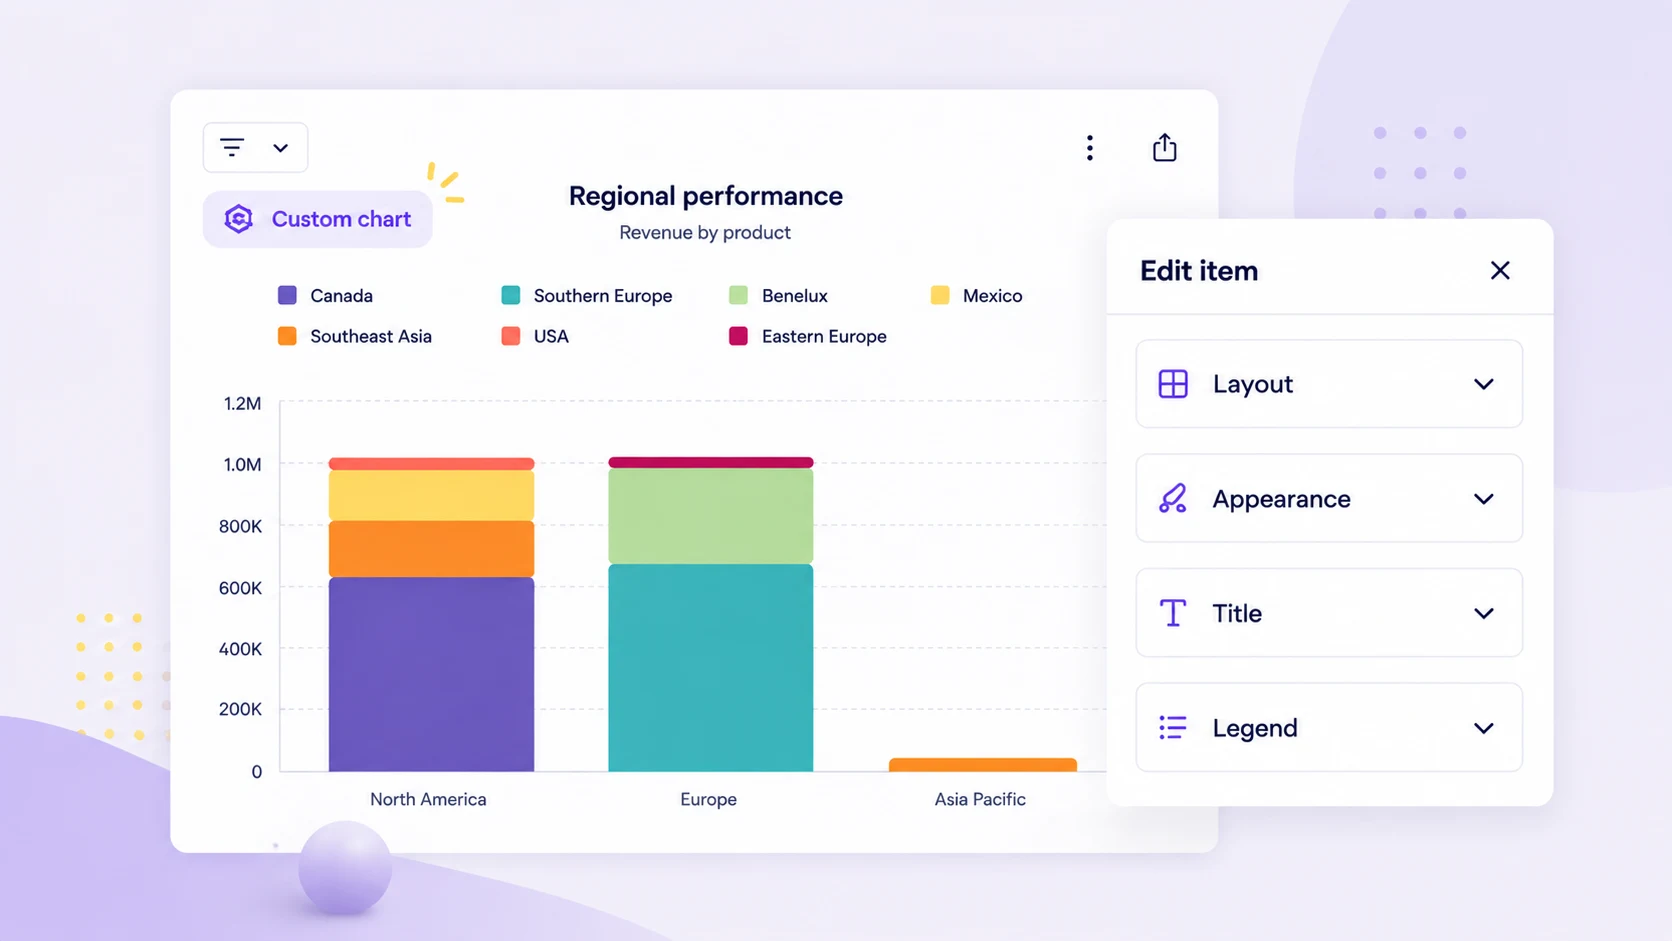
Want the same custom chart with a different forecast length on another dashboard? That's a setting now, not a second chart.
Now custom charts can carry their own options. The chart author defines the controls, and dashboard editors set them from the Edit item panel in Studio, in exactly the same place they adjust options on Luzmo's standard charts. One chart, many use cases, no rebuild.
You get:
- Author-defined controls: declare options in your chart's
manifest.jsonand pick the control for each one, from toggles and dropdowns to sliders and text inputs. - No code for the editor: dashboard editors see those controls in the Edit item panel and change them without touching your chart.
- Your code decides what they do: whatever gets set is passed into your chart's
rendermethod, so an option can switch a forecast length, change a color, toggle a label, whatever you wire up. - Localized labels: translate option labels in the manifest so the controls show up in the viewer's language.
→ Dive into the Custom Charts options docs (opens in new tab)
Slice array columns properly
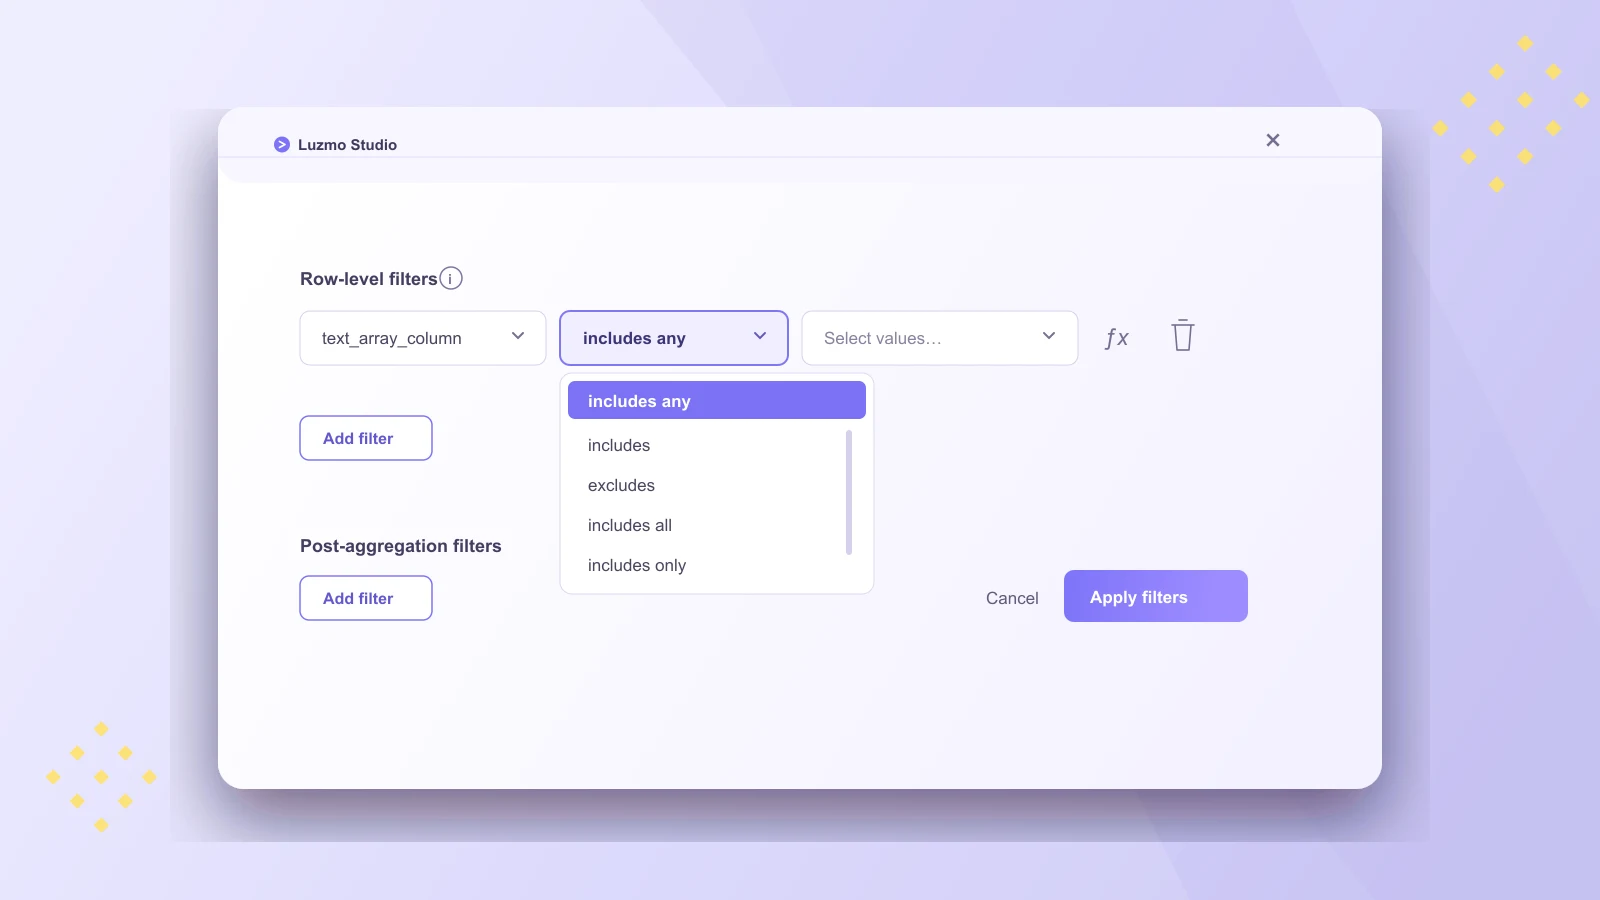
If your data has array columns (tags, languages, product codes, regions), you can now slice them precisely. There's a set of array-specific filter expressions you can apply as chart, dashboard or embed filters.
A few things you can now ask for:
includes all: products tagged food AND healthy.includes any: employees who speak English OR French.includes only: products tagged food and healthy and nothing else.excludes: companies that do not operate in Belgium.has value starting with: orders containing a product code that starts with "EU-".has value containing: articles where one of the keywords contains "climate".
There's more in the set than that: includes, has value ending with, does not have value containing, and three length checks for slicing on how many elements an array holds. Text matching is case insensitive, and with includes only the order of your values and any duplicates don't affect the match.
Which expressions you get depends on the column's type. Array hierarchy, array date and array numeric columns each come with the set that suits them.
Native array columns work on PostgreSQL and ClickHouse today, plus custom plugin connectors that expose array types. This is the first version, and it's a real building block: array columns finally behave like something you can query, not just store.
→ Read up on native array columns (opens in new tab)
We also shipped
A clearer plugin setup experience. Creating and editing a plugin now share one form and one set of components, and creating a plugin is a single step. Plugin settings also spell out the optional capabilities a plugin supports (joins, ordering, nested filters, array handling, distinct counts), so what a plugin can do is visible up front. Authentication is clearly labelled and locks after creation, custom authorization properties are managed inline, and newly created plugins scroll into view and highlight so you can see what you just made. Plus a handful of smaller fixes: clearer required fields, a color picker that defaults to your current primary color, long descriptions that wrap, and error messages that stay in the viewport. You'll find it under Settings → Plugins.
→ See the plugin docs (opens in new tab)
Get started with these new features
Everything here is live in your Luzmo account right now. Open a dashboard and try switching a chart type, it takes about four seconds.
Questions or feedback?
Reach out to your CSM or drop us a line at hello@luzmo.com.
Written by

Ship the future of your data
Let us show you what Luzmo can do for your product.

Book your session with our analytics expert.