Product Release Update – November 2026
This month is about putting more context in front of your users, faster. Every answer arrives in about half the time, and every number can now show exactly what it's compared against.
Here's what's new: agents that answer about twice as fast, a KPI widget with built-in period comparison, an agent in Studio that takes you from a question to a finished chart, Rules you can manage from the AI assistant you already work in, and fields your customers create for themselves in the embedded editor.
Your AI now answers twice as fast
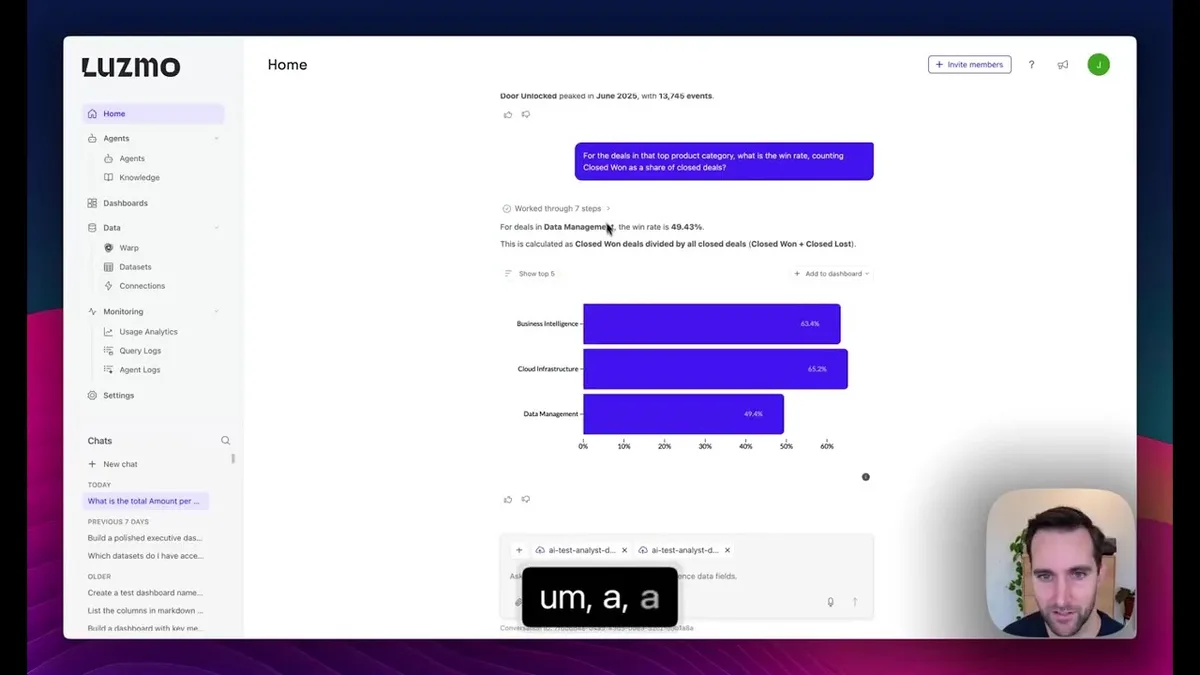
Your users get AI answers about twice as fast. We rebuilt the Universal and Analyst agents behind them, and in our test set answers arrive in roughly half the time, with the same quality or better.
The agent now decides which steps each question needs, and the Universal and Analyst agents share the same code, so every request takes the shortest path to an answer. We measured it on 290 questions drawn from customer examples, public benchmarks and common use cases.
You get:
- First words in about 3.7 seconds: on average across our test set.
- Complete answers in about 7.6 seconds: charts included.
- Strong multi-part answers: questions that combine several asks come back complete.
- Long conversations that stay on track: the agents follow along as a conversation moves between topics.
- Nothing to change on your side: in-app chat, the API, embedded components and the MCP server all use the new agents.
It's live for every customer with AI features turned on. If you run Luzmo on your own infrastructure on the long-term-support release, it arrives with a later update.
→ Get started with the Luzmo AI API (opens in new tab)
A KPI that says what it's compared against
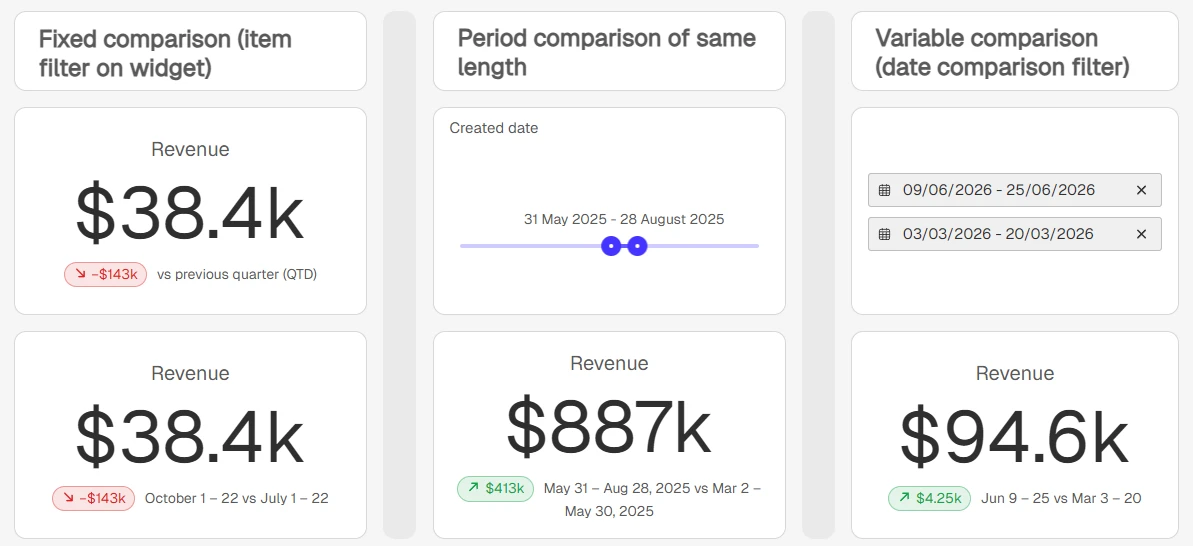
A headline number is often the first thing your users look at, so it should carry its own context. The new KPI widget shows one metric, how much it moved, and the exact period it's compared with, all on one card: "Revenue €20,140, up 12% vs previous month (MTD)".
Add KPI from the General group, put your metric in Measure and the same column in Comparison, then pick how to compare in the Comparison slot menu. It uses the same period-over-period logic as our bar and line charts, so the numbers line up across a dashboard.
You get:
- Three ways to compare: a fixed offset (this quarter vs last quarter), the same-length period right before the selected range, or two custom periods your end users pick in a Date comparison filter.
- Period-to-date: compare incomplete periods fairly with YTD, QTD, MTD and WTD.
- A clear comparison label: "vs previous year (YTD)", a date range like "Oct 1 – 22 vs Jul 1 – 22", or no label at all.
- % or absolute change: your choice, per widget.
- A polished card: works on light and dark themes, with green/red trends, a "lower is better" option, custom colors, and controls for size, alignment, number style and the comparison pill.
The KPI is a new widget that sits alongside Number with evolution (now in the Gauges group), so your existing dashboards stay exactly as they are. Reach for Number with evolution when you want a sparkline. Luzmo AI and the dashboard agent already use the new KPI as their default number widget.
→ Set up a KPI with period comparison (opens in new tab)
Go from question to chart with the agent in Studio
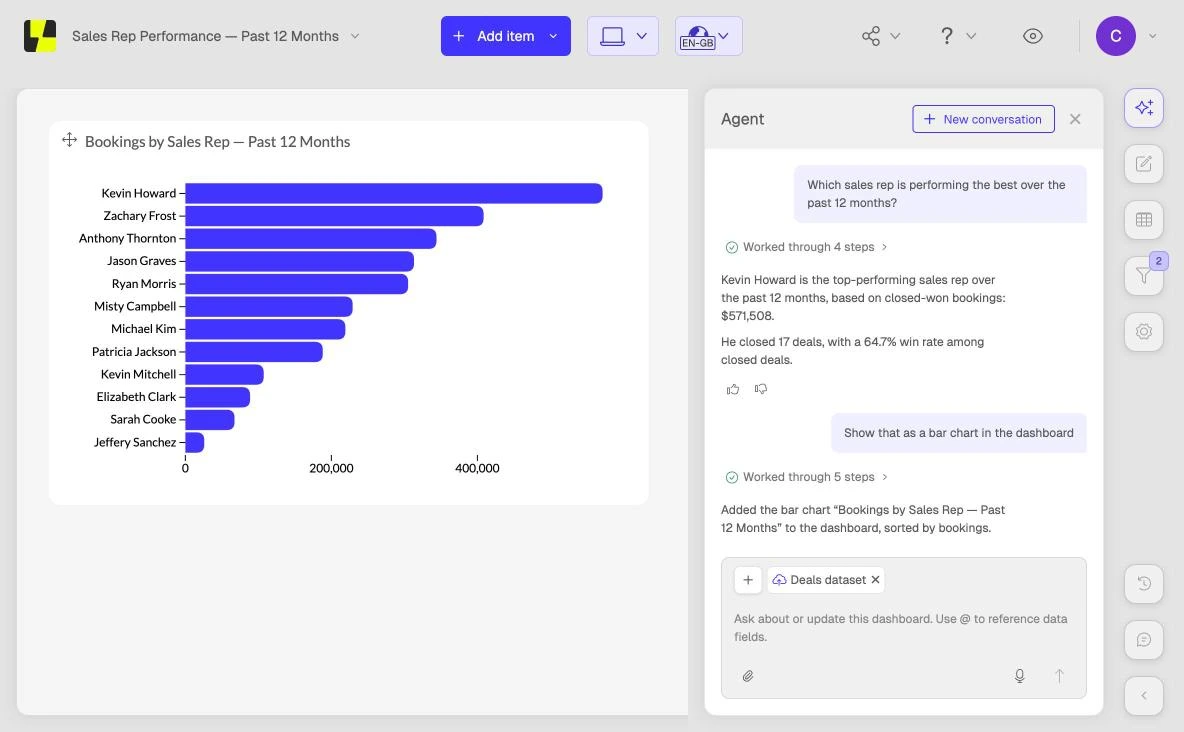
Find out what your data is telling you and turn it into a chart, all in one conversation and without building anything by hand. Ask the Agent panel in Studio to summarize the key insights of a dashboard, and it runs the queries and tells you what the data says, with the numbers to back it up.
The Agent panel in Studio runs on the same agent that answers your users' questions, so it analyzes as well as builds. Ask "which sales rep performed best over the last 12 months?", get the answer with the numbers behind it, then say "show that as a chart" and it lands on the dashboard.
You get:
- Real answers: findings backed by queries on your data, the same quality your users get from AI chat.
- Ask, then build: go from a question to a chart or a full dashboard without switching tools.
- New measures on the fly: the agent calculates new measures for its analysis.
- Charts and full dashboards: create and edit them in the same conversation.
The same agent comes to your embedded dashboard editor with the upgraded editor we're rolling out, so your end users get an analyst right where they already build. Ask your CSM if you'd like it switched on for your account now.
→ Turn the Dashboard Agent on or off with feature flags (opens in new tab)
Manage Rules straight from Claude or ChatGPT
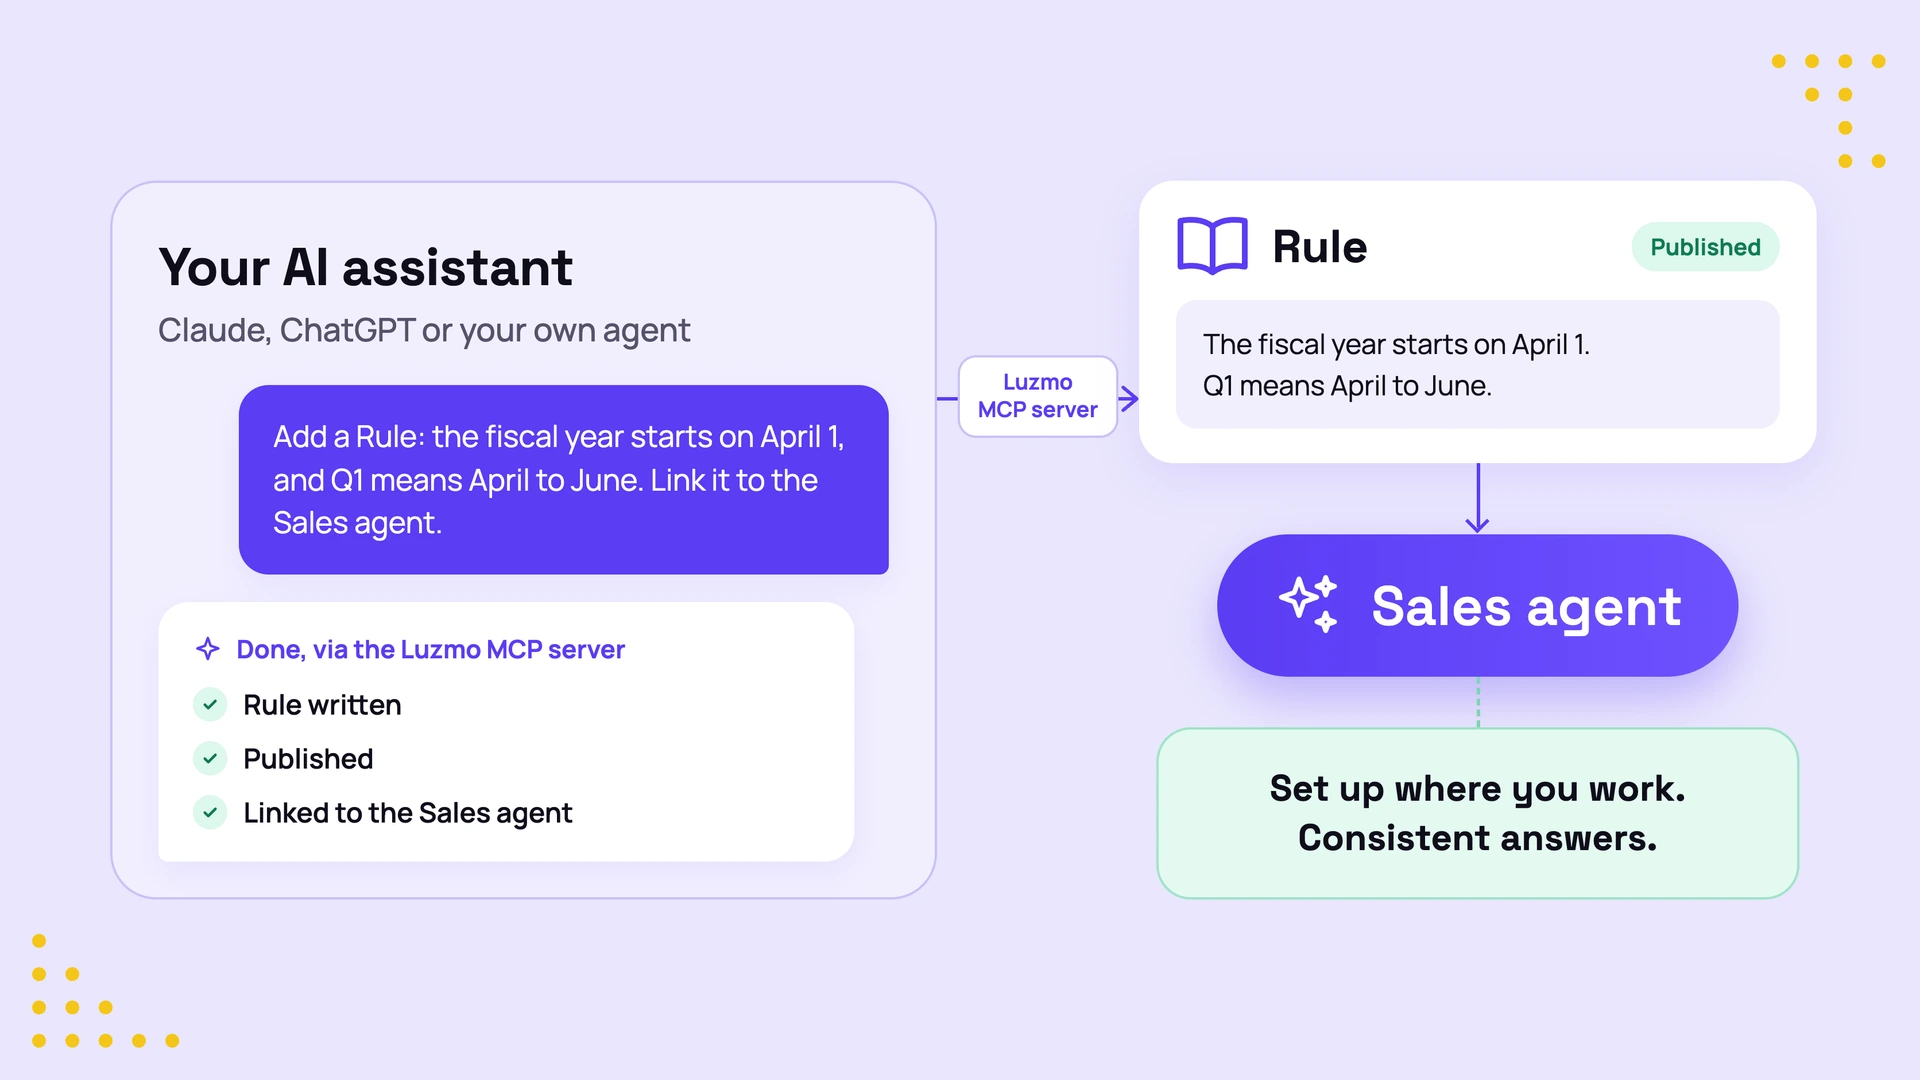
Working in Claude and want an Agent to handle a term your way? Write the Rule, publish it and link it to the Agent in that same chat.
The Luzmo MCP server can create, edit and publish Rules and link them to your Agents, from Claude, ChatGPT or your own agent. It's also the fastest way to set up a batch of Rules: describe them once and create and link them in one conversation.
You get:
- Stay where you work: write the Rule, publish it and link it without leaving your AI assistant.
- Bulk setup: create and link many Rules in one go.
- The same lifecycle as the app: drafts have no effect, and Agents keep using the published version until you publish again.
Deleting Rules from the MCP isn't supported yet; do that in the app under Agents → Knowledge.
→ Get started with the Luzmo MCP server (opens in new tab)
Want to see Rules and AI context in action? Watch Jasper and François in Why context makes or breaks AI analytics, live on November 24.
Let your customers create their own metrics
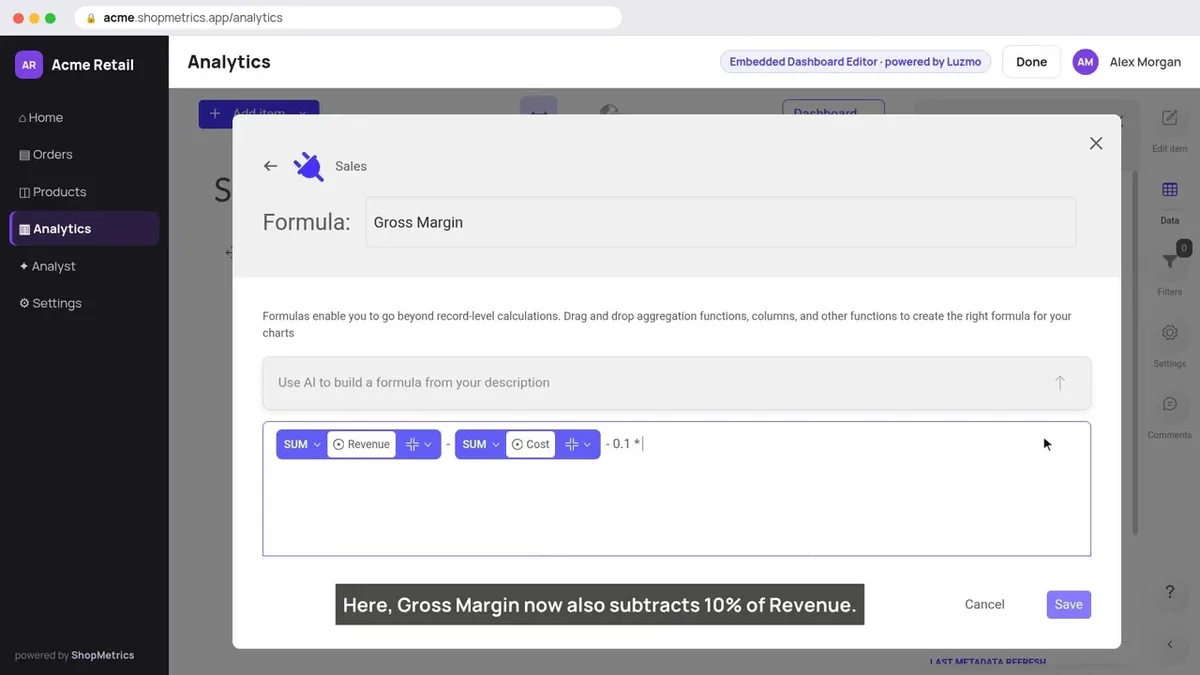
Your end users can create their own formulas right in the embedded dashboard editor. Say a user at one of your customers adds Gross Margin as revenue minus cost: it's saved for their company only, they can drag it into a chart straight away, and they can edit it whenever they like.
This builds on Custom Fields, which give each customer fields of their own on one shared dataset. Set the tenant in the embed token and give tenant_fields_rights: "use" on the dataset, and every formula or derived column your end users create is assigned to their tenant automatically.
You get:
- Fields your customers own: they create, edit and delete their own formulas, with read access to the dataset.
- Private to each customer: other customers on the same dataset never see them.
- Answers that use them: ask your AI about the new field, and the answer uses the customer's own formula.
- One dataset to maintain: you keep one shared model while each customer adds what they need.
Custom Fields control which fields a customer sees, not which rows, so keep your row-level security in place.
→ Read the Custom Fields guide in the Academy (opens in new tab)
We also shipped
- Keyboard and screen-reader support in embedded dashboards. The first batch of accessibility improvements is live on every embedded dashboard and chart. Your users can work every filter (date, date comparison, slicer, dropdown, slider and search), the export, alert and measure/dimension menus, info tooltips and legend items with the keyboard alone, with a visible focus state. Screen readers now announce chart titles, controls and loading states. More improvements follow over the coming weeks.
- Guided dataset links. When you link two datasets, Luzmo checks whether the link runs the right way and offers to flip it if it looks reversed, so your data model stays clean from the start. → Linking datasets (opens in new tab)
- Chat history in the AI chat panel. When you switch on AI chat for a dashboard from Studio, your users can now reopen past conversations or start a fresh chat. History is kept per user and per dashboard. → AI chat on any dashboard (opens in new tab)
- Period comparison on duration columns. Compare durations, such as average handling time or time to resolve, with a previous period, just like any other measure. → Period comparisons (opens in new tab)
- One switch for AI, per user. Turn every AI feature on or off for each user with a single setting on the embed token, and it covers the AI features we add later too. Handy when you want to roll out AI to some of your users first. Customers on the long-term-support release get it with a later update.
- Databricks service principals. Connect Databricks with a service principal (OAuth machine-to-machine) instead of a personal access token. → Connect Databricks (opens in new tab)
- A streamlined Snowflake setup. The connection window separates username/password from key-pair authentication, so you only see the fields you need. → Connect Snowflake (opens in new tab)
Get started with these new features
Everything here is live in your Luzmo account now. Add a KPI to a dashboard, or open the Agent panel in Studio and ask it a question about your data.
Want to see Rules and AI context in action? Watch Jasper and François in Why context makes or breaks AI analytics, live on November 24.
Questions or feedback?
Reach out to your CSM or drop us a line at hello@luzmo.com.
Written by

Ship the future of your data
Let us show you what Luzmo can do for your product.

Book your session with our analytics expert.