6 Best Built-in Analytics Platforms in 2026

Let’s cut to the chase: built-in analytics is now table stakes for any serious digital product, whether you’re building SaaS, internal platforms, portals, or industry apps. If your users have to export to Excel, wait for the next release for custom reports, or struggle to find answers, your analytics aren’t working—and your competition knows it.
Luzmo’s latest industry report, “Dashboards: Dead, Dying, or Evolving?”, polled 200+ product, data, and executive leaders. The headline? Most dashboards are falling short. In fact, 72% of users admit they bypass dashboards by exporting to Excel—the clearest sign that analytics must be truly built-in, not bolted on. Get the full report and dashboard statistics here.
Why built-in analytics is a baseline, not a bonus
Analytics that sits on the side, disconnected from core workflows, is invisible. And invisible analytics means lost insight, lost time, and lost revenue. When dashboards are slow to build, hard to use, or just “feel” separate from the rest of the product, adoption tanks and support tickets spike.
Users today expect answers inside the tools they already use. If your analytics aren’t instantly available, interactive, and tailored to each role or context, your users will find a workaround—or a new vendor. Forward-thinking teams are raising the bar: analytics must be native, adaptable, and intelligent.
Best built-in analytics tools in 2026 and beyond
1. Luzmo: Built-in analytics that actually gets used
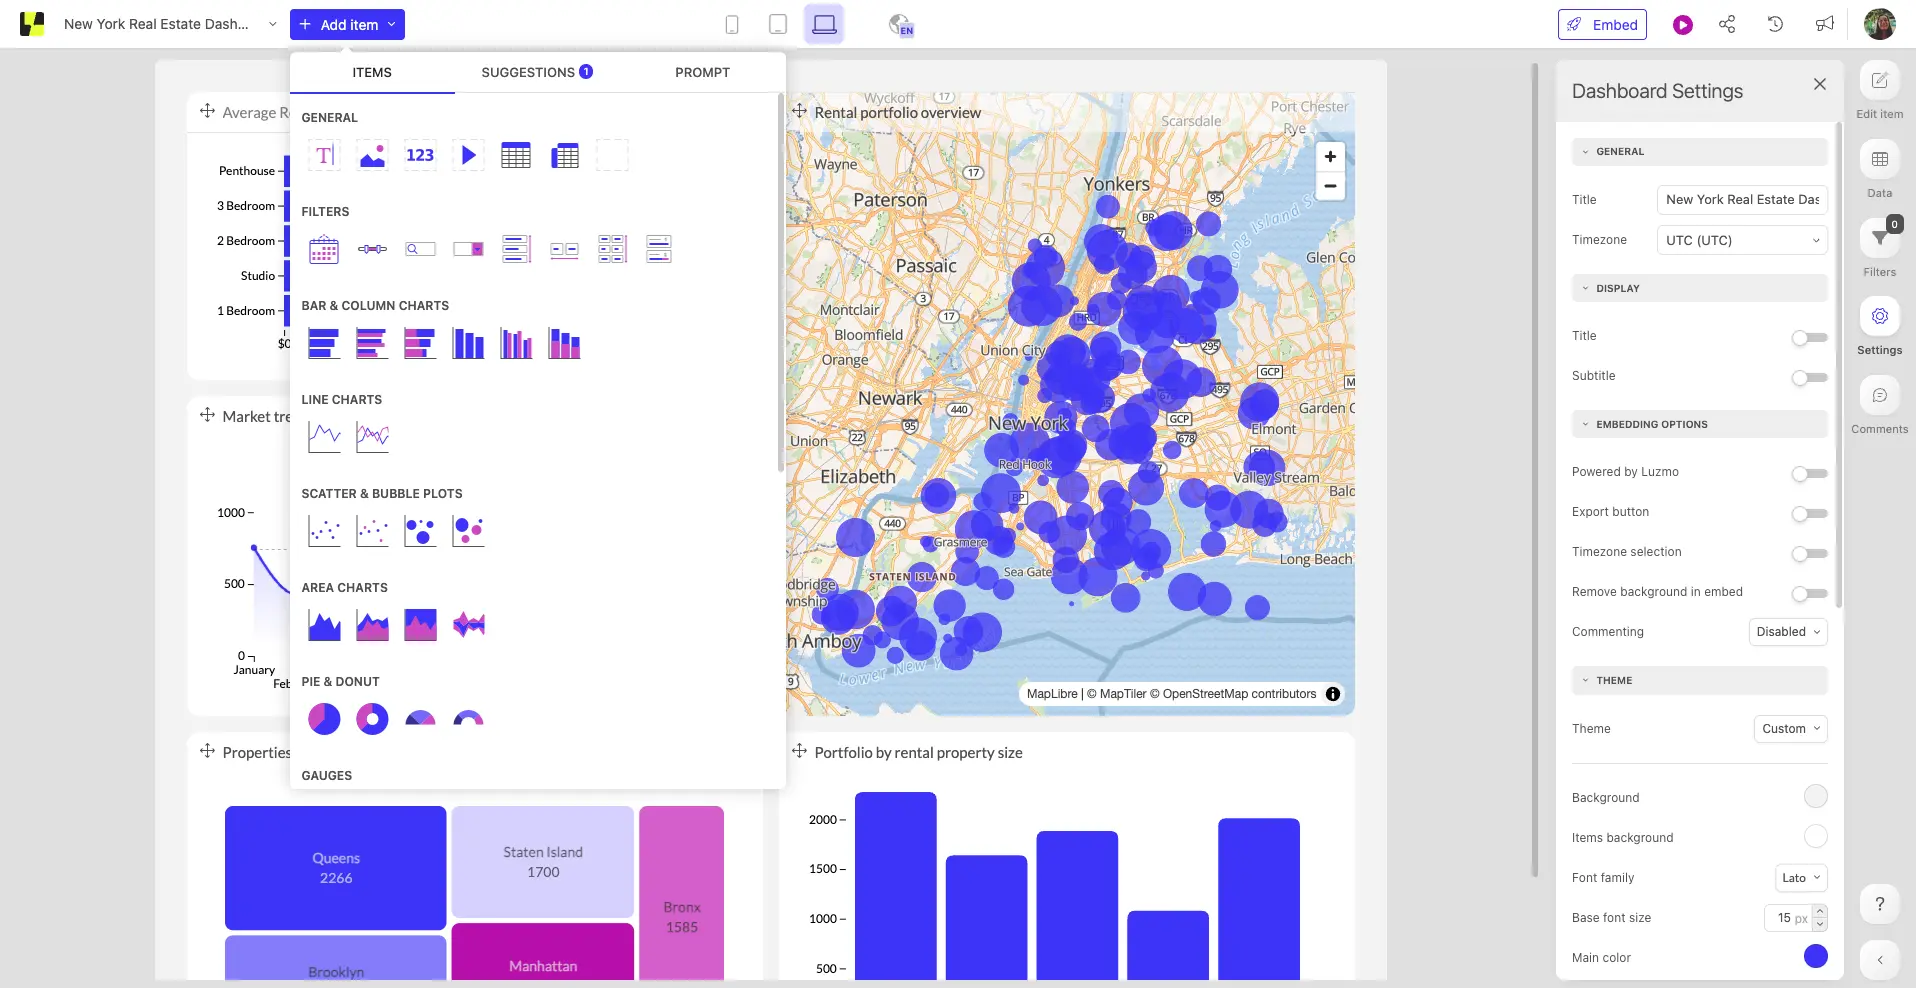
When teams set out to add analytics to their product—whether it’s a SaaS platform, customer portal, or industry app—the big fear is that the feature will gather dust. Luzmo exists to solve that problem. Its approach isn’t just to “embed a dashboard” but to make analytics an organic, actionable layer within your product, accessible to every user, every day.
Why is that so critical? According to Luzmo’s recent industry report, 72% of users regularly bypass dashboards by exporting to Excel. The message is blunt: if analytics doesn’t feel built-in—fast, interactive, part of their daily workflow—users will just work around it. Luzmo’s platform is built to end that disconnect for good.
How Luzmo delivers on the “built-in” promise
Luzmo starts where other platforms stop. Its embedded analytics platform is designed for native integration, so dashboards and analytics widgets blend seamlessly into your product’s interface, no matter the complexity or design system. You’re not locked into rigid templates or forced to compromise on brand—full white-labeling comes standard.
The embedded dashboard editor empowers your end users to create, adapt, and personalize their own reports right inside your application. For product teams and ops leaders, that means less time firefighting custom requests and more time building real value. For business users, it means answers are always just a few clicks away—no IT tickets, no downloads, no waiting.
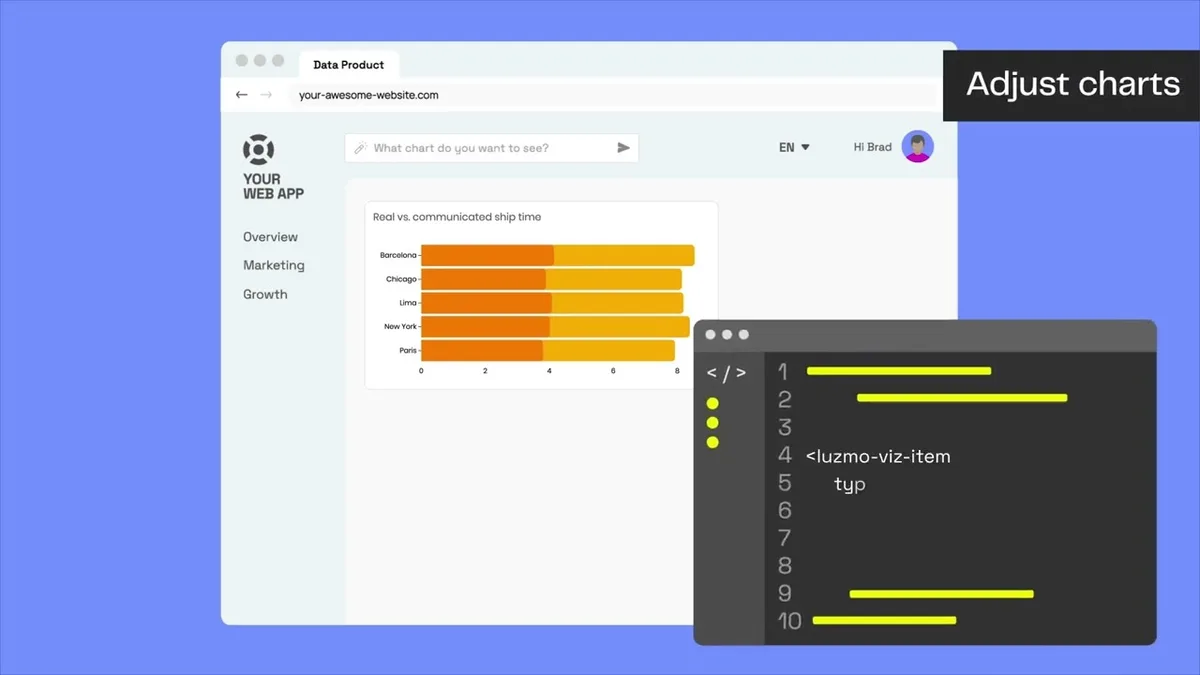
Luzmo Flex is the toolkit for teams that want complete control over the analytics experience. With Flex, developers and designers can build custom analytics components—think KPIs, charts, entire reporting modules—that match even the most unique workflows and UI standards. No more “close enough” or compromise: analytics fits your product, not the other way around.
The Luzmo IQ conversational analyst brings the power of AI right to your end users. Instead of learning SQL or relying on the data team, users can ask questions in natural language, get instant chart recommendations, and see anomalies flagged automatically. This isn’t just a feature for the future—it’s already driving better adoption and engagement for companies today.
On the backend, Luzmo Connect takes the headache out of data integration, supporting everything from cloud warehouses and REST APIs to more traditional databases. It comes with "batteries included", handling all the heavy lifting like querying, data acceleration, access control,... You get a real-time, secure, and scalable foundation—whether you’re building for ten clients or ten thousand.
Designed for every digital product—not just SaaS
Luzmo’s architecture was built to handle the needs of diverse industries:
- For financial platforms, compliance and auditability come standard.
- For logistics and operations portals, live data and real-time decision support are built in.
- For customer-facing web apps and partner dashboards, multi-tenancy, permissioning, and branding are robust enough for even the most demanding clients.
Want to see the difference? Luzmo’s dashboard statistics report breaks down how built-in analytics leads to better retention, fewer support tickets, and higher NPS—no matter the industry.
Built for teams that don’t want to compromise
- Fast time-to-market: Launch analytics in weeks, not quarters.
- No BI expertise required: Empower non-technical users with drag-and-drop editing, AI assistance, and a truly intuitive experience.
- Cost that scales with you: Transparent pricing that grows with you, as your user base grows.
- Flexibility at every stage: From first demo to advanced comparison (see how Luzmo stacks up) and customer migration stories, you’ll find answers at every step.
Luzmo’s approach to built-in analytics is clear: if users are still exporting to Excel, your analytics aren’t built-in enough. With Luzmo, analytics becomes a living part of your product—driving real decisions, day after day.
2. Tableau: Visualization royalty, but not built for modern product teams
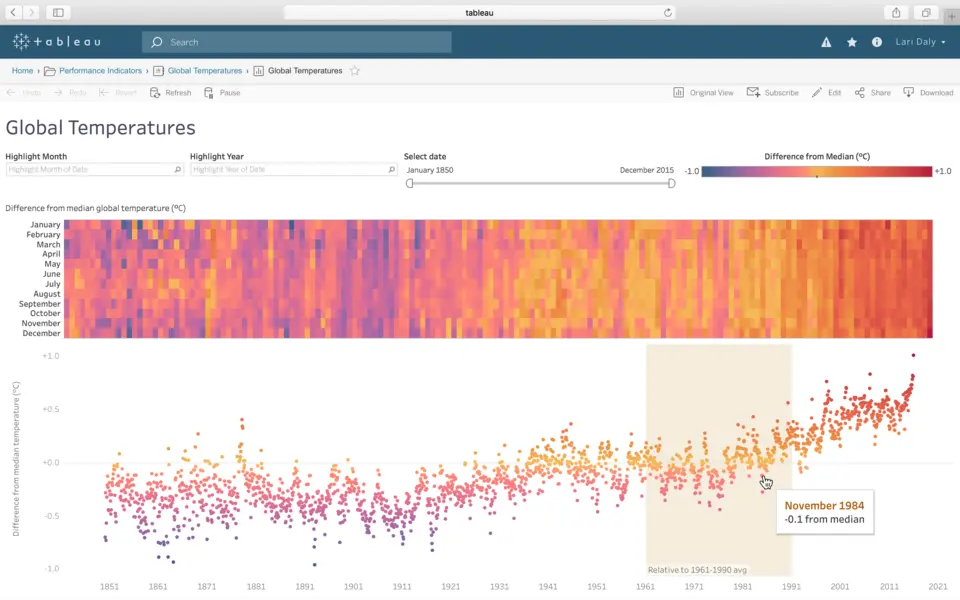
Tableau is still the name most business intelligence pros mention first. Its visuals are best-in-class, and its developer tools are deep. But when it comes to actually building analytics into your product, the platform starts to show its age.
- Strengths: Advanced charts, deep data exploration, active community.
- Shortcomings: Customization is limited if you want analytics to look and feel native to your product. The embedding process is cumbersome for non-Tableau experts, and costs scale quickly—especially for multi-tenant or external use cases.
- User feedback: Even fans admit Tableau’s learning curve is steep. Teams that don’t already use Tableau internally often feel locked out by licensing and complexity. Iterating on dashboards is slow, and users report that embedding isn’t as smooth as with purpose-built built-in solutions.
Bottom line: Tableau is a heavyweight for data analysts, but if your users expect seamless, interactive analytics inside your product, there are better choices.
3. Sisense: Powerful, but not always practical
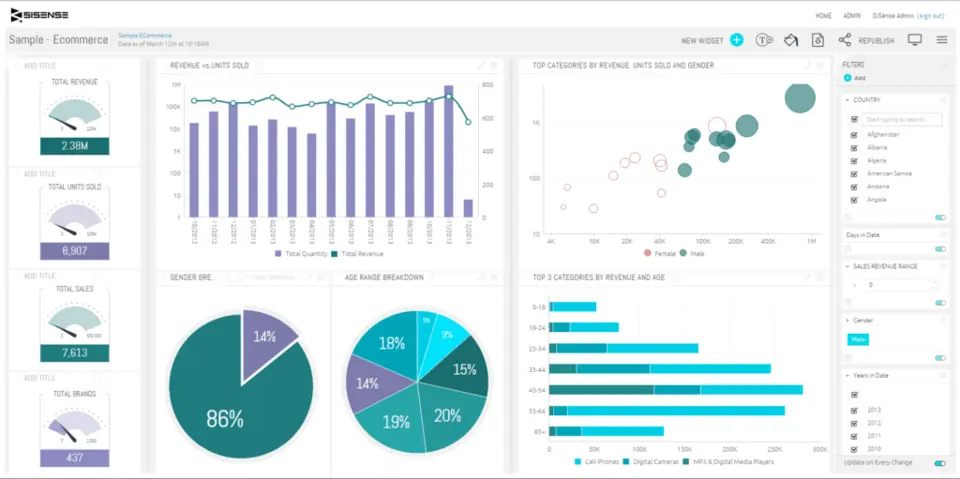
Sisense promises full flexibility—an analytics layer you can deeply customize to fit any data architecture or user flow. For companies building OEM products, or serving demanding enterprise customers, that’s appealing. But “powerful” often means “complex.”
- Strengths: Multi-tenancy, granular security, its Compose SDK, and the ability to embed analytics nearly anywhere.
- Shortcomings: Performance and usability both require serious investment from your team. If you don’t have experienced BI developers, implementation will drag. Support is inconsistent, and upgrades can be disruptive.
- User feedback: Many reviewers appreciate Sisense’s capabilities, but just as many cite frustrations: sluggish dashboards on large datasets, time lost on data modeling, and limited guidance for everyday business users.
Sisense is a fit if analytics is your core business—or if you have the resources to build out a dedicated BI function. For most digital products, simpler and more adaptive solutions win out.
4. ThoughtSpot: Fast, friendly search—but not for everyone
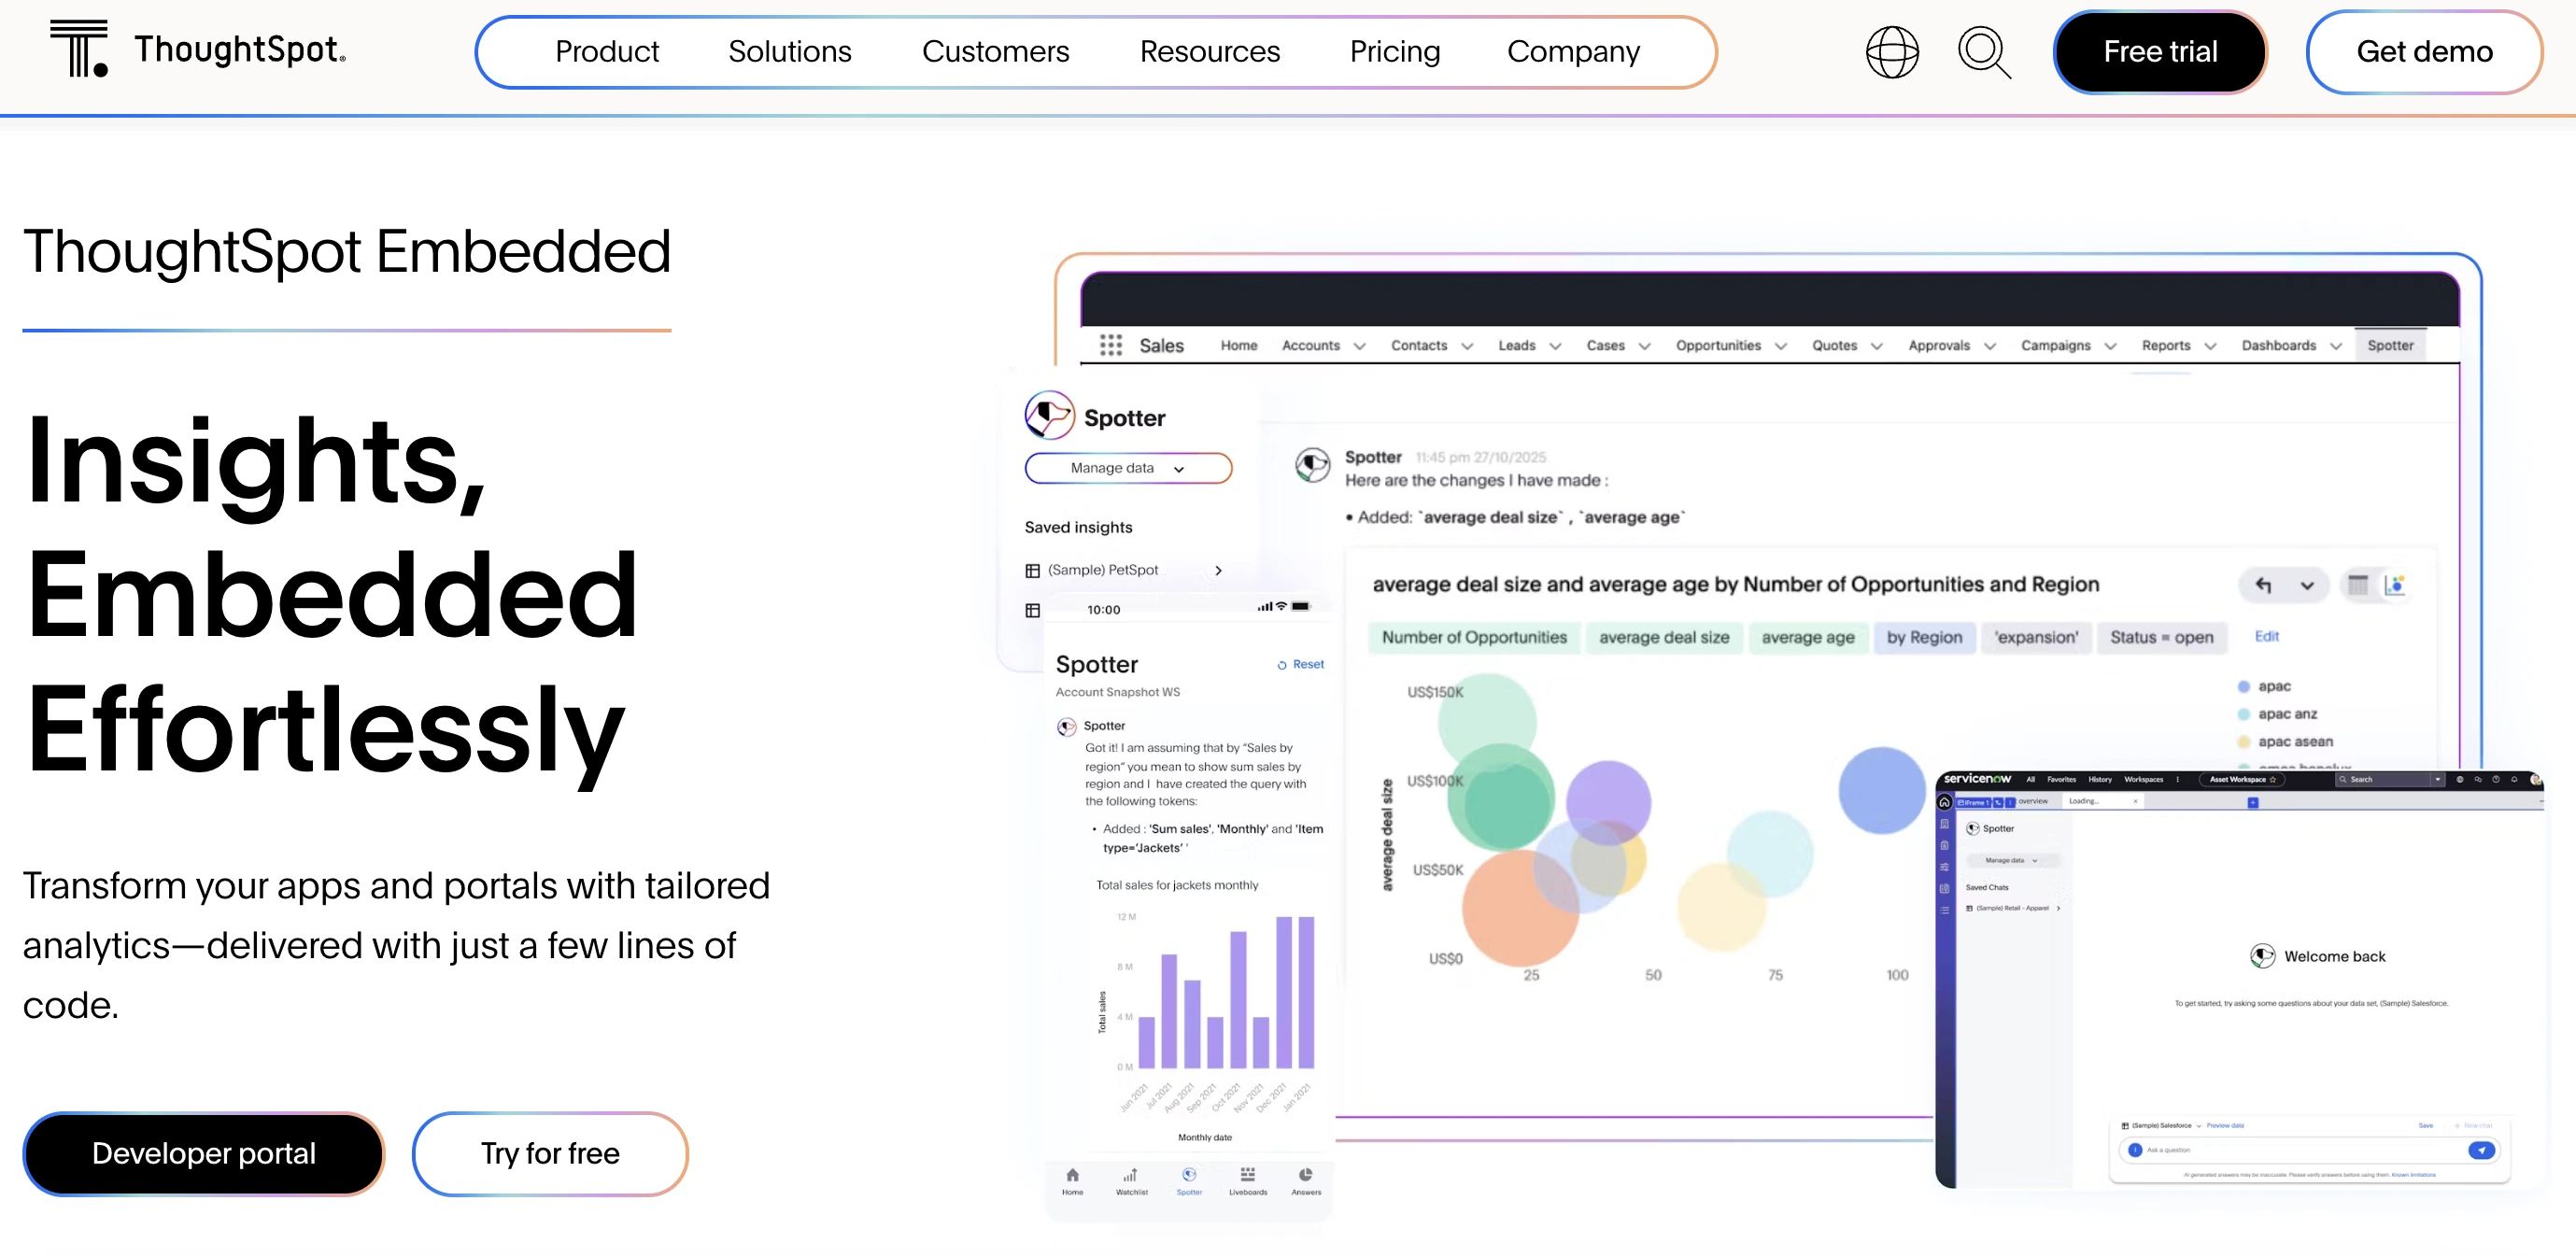
ThoughtSpot’s main claim: search-driven analytics. It makes analytics accessible to everyone, not just analysts. Type a question, and you get instant answers. These days it also markets an agentic platform — Spotter agents and an MCP server — beyond search.
- Strengths: Natural language queries and charting, rapid setup, and an intuitive interface for business users.
- Shortcomings: To really make ThoughtSpot work, you’ll need to spend time and expertise on data modeling. Visualization and branding options are limited, making it hard to create truly native built-in experiences.
- User feedback: Business teams like how easy it is to ask questions. Developers and designers, on the other hand, are frustrated by limited customization and integration depth.
ThoughtSpot is best for organizations prioritizing ease of use above deep customization. If you need analytics to feel and behave like part of your product, you may find it limiting.
5. Domo: Jack-of-all-trades, master of few
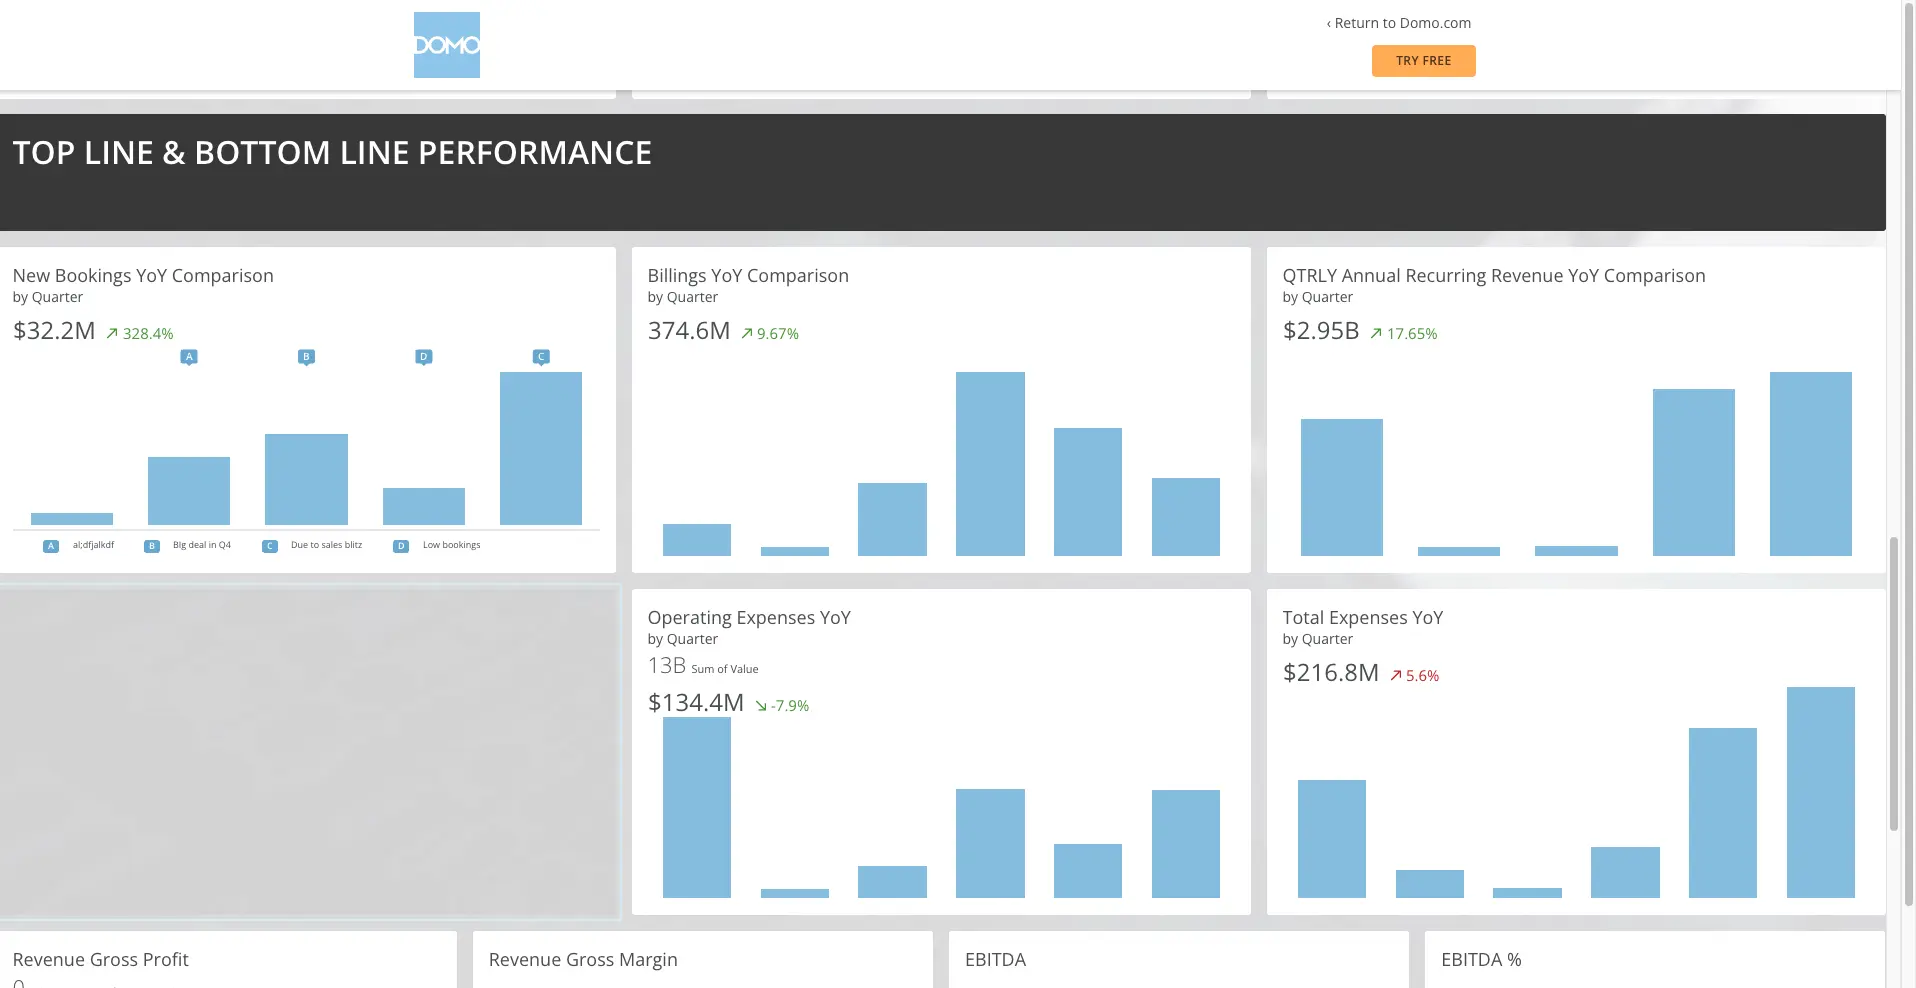
Domo brands itself as a complete data platform—connectors, data prep, dashboards, embedded delivery via Domo Everywhere, and Domo.AI agents. But that “one-stop-shop” comes at a price.
- Strengths: Huge catalog of data connectors, fast onboarding, and basic dashboarding for business teams.
- Shortcomings: The out-of-the-box UI is generic, so building analytics that truly feel integrated is difficult. Cost escalates rapidly at scale, and advanced customization often requires workarounds or external help.
- User feedback: Many teams like Domo for prototyping or basic reporting, but as needs grow, they hit walls in flexibility and ownership.
If your analytics requirements are simple or you need an all-in-one platform for multiple departments, Domo delivers. If you care about product-native, highly branded analytics, keep looking.
6. GoodData: Technically solid, but business users may struggle
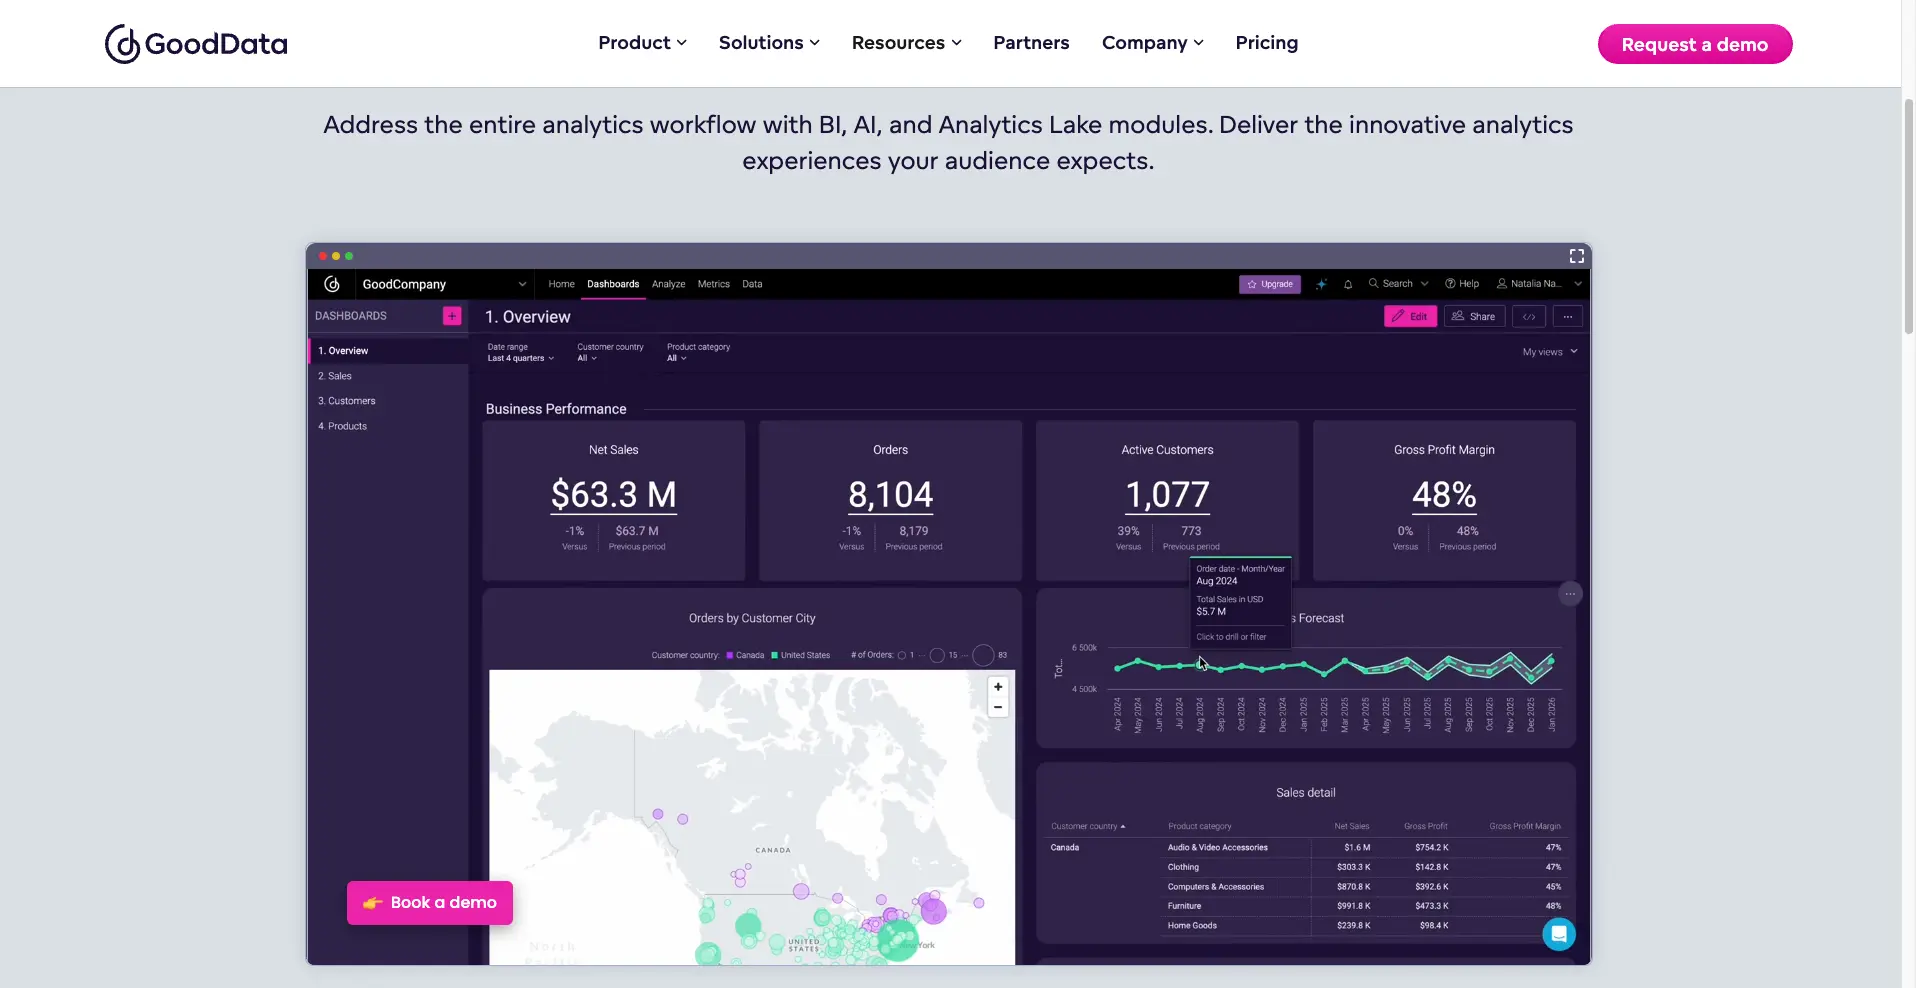
GoodData is a developer’s friend—API-first, modular, and scalable. It’s a fit for teams with unique requirements or highly regulated industries.
- Strengths: Flexible integration, strong multi-tenancy, and compliance features built for scale.
- Shortcomings: The learning curve is steep, and business users often find it unintuitive. Visual customization is possible, but takes time and technical skill.
- User feedback: Developers praise the documentation and APIs. Non-technical users feel left behind without strong IT support.
GoodData is a good match for complex data environments, but not for teams seeking plug-and-play or low-code solutions for built-in analytics.
How to pick the right built-in analytics platform
- Who will use analytics? If it’s not just developers, prioritize self-service features, intuitive editors, and flexibility.
- How custom do you need to get? If branding and unique user journeys are key, check out Luzmo Flex and white-label options.
- How fast can you deliver value? If you’re losing ground to Excel exports or dashboard requests, speed to insight matters more than raw power.
- Can you grow with it? Look for platforms with proven multi-tenancy, security, and compliance.
- What does support and community look like? Don’t underestimate how much you’ll need real help when stakes are high.
If you want to benchmark your options, compare Luzmo with other solutions, check dashboard statistics and adoption data, or talk to Luzmo’s experts for a hands-on look at what’s possible. Transparent pricing and a robust integration ecosystem mean you’ll never feel locked in or stuck.
Dashboards aren’t dead, but static, disconnected analytics is. Built-in analytics, designed for action and adaptability, is where digital products are headed. Luzmo leads the way. Ready to build something users actually want? Start with Luzmo or get inspired by market leaders who already switched.
Written by

Ship the future of your data
Let us show you what Luzmo can do for your product.

Leave your e-mail and one of our analytics experts will reach out to you