7 Best Omni Analytics Alternatives in 2026
Omni Analytics has built a following among data teams who love its Looker-inspired semantic layer and SQL-first flexibility. But for SaaS product teams building customer-facing analytics, Omni increasingly shows its limits: opaque pricing, a steep learning curve, and an embedded analytics layer that was added on rather than built in from day one.
If you've been evaluating Omni — or you're already using it and hitting walls — this guide covers seven alternatives worth considering.
Why look for an Omni Analytics alternative?
Omni is a capable tool. The reviews make that clear: users praise its customer support, intuitive UI, and the elegance of combining a governed semantic layer with ad hoc SQL. But recurring complaints reveal real friction, especially for teams building analytics into products rather than internal dashboards.
Here's what keeps coming up:
Steep learning curve around topics and the semantic layer
Setting up Omni's topic model takes meaningful time and expertise. Users consistently flag that onboarding, especially for non-technical team members, is harder than expected — and documentation sometimes lags behind new releases, which makes self-directed setup even slower.
Missing features and product immaturity
Omni is a relatively young product, and reviewers are candid about it. Notifications, better report organization, and more polished chart types are recurring feature requests. As one G2 reviewer noted, it "doesn't yet match the feature set of some of the more established tools." The pace of releases is promising — but the gaps are real today.
Dashboard instability on complex models
Complex dashboards can crash, particularly when the underlying data models are large or intricate. Multiple reviewers have flagged this, noting that performance depends heavily on how well the data model is built — a significant burden for teams without dedicated BI engineers.
Chart customization requires JSON wrangling
Omni's charts use Vega-Lite under the hood. Going beyond the out-of-the-box options means editing JSON configuration by trial and error. Native visualizations like KPI tiles feel polished, but the inconsistency in chart quality is a genuine usability issue.
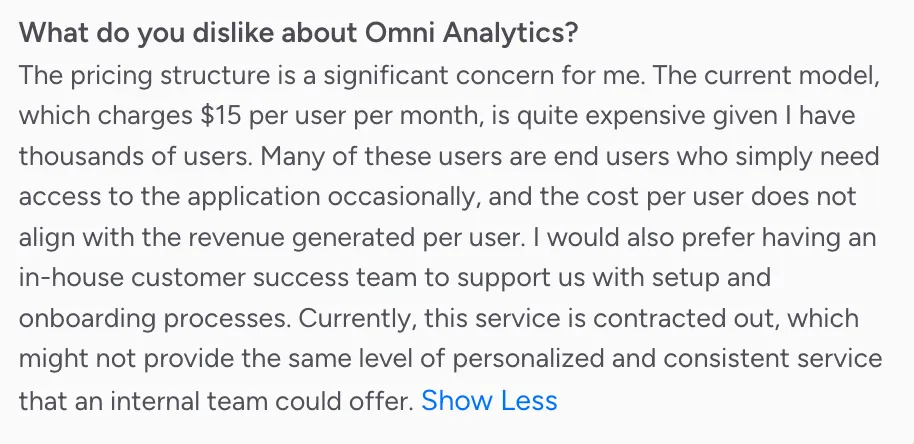
No public pricing
Omni's pricing is entirely sales-led. There's no published plan, no free tier to evaluate properly, and no way to estimate cost before a sales conversation. For teams that need to get stakeholder buy-in or move quickly, this friction is real — and competitors are increasingly offering transparent pricing as a differentiator.
Embedded analytics is secondary, not primary
This is arguably the most important limitation for SaaS teams. Omni markets itself as both an internal BI tool and an embedded analytics platform — but the product architecture reflects its BI origins. Viewer-scale pricing, full CSS white-labeling, multi-tenant isolation, and SDK-first embedding are not where Omni invests its core roadmap. If those capabilities are central to your product, you're working against the grain of the platform.
Best alternatives to Omni Analytics
1. Luzmo: best overall Omni alternative for embedded analytics
If you're building analytics into your product – not alongside it – Luzmo is the strongest alternative to Omni.
Where Omni treats embedding as one of several delivery modes, Luzmo was designed from day one with a single purpose: analytics that lives inside your SaaS product, fully branded as your own.
_Built for embedding, not adapted to it
_
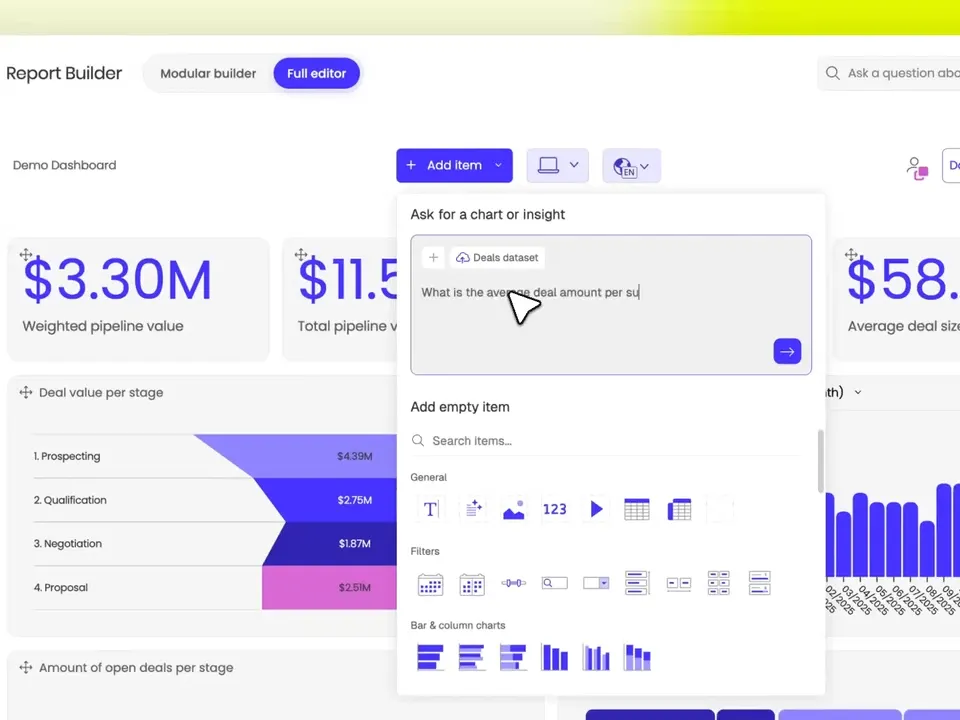
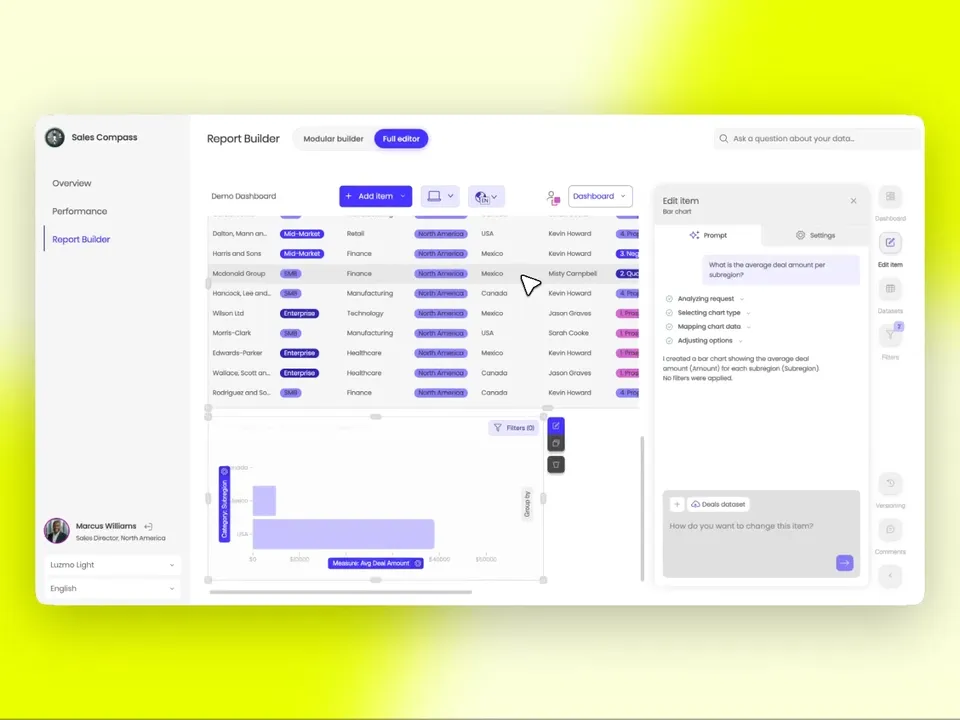
The architectural difference matters. Luzmo's embedded analytics studio gives product teams a no-code dashboard builder that drops directly into any application. There's no semantic layer to model, no Vega-Lite JSON to debug, and no internal BI scaffolding to work around. You connect your data, build your dashboards, and embed them: typically within days, not months.
Full CSS control and custom domain support mean Luzmo disappears into your product. End users never know they're looking at a third-party analytics layer. That level of white-labeling is not available out of the box with Omni.
_Self-service analytics that scales to your users
_
Luzmo's self-service analytics layer gives your end users the ability to build, modify, and save their own dashboards, without needing SQL knowledge or analyst support. This is the capability that product teams consistently underestimate: embedding a static dashboard is step one, but giving users the tools to answer their own questions is what drives actual retention and expansion revenue.
Omni has a "Create Mode" for end users, but it's oriented around internal analysts. Luzmo's self-service is designed for customers — non-technical users who need to answer business questions in the context of your product.
Composable analytics for developer teams
For engineering teams that want full control, Luzmo offers composable analytics — a modular approach where analytics UI components are assembled rather than configured inside a monolithic dashboard tool. This matters when your product has opinionated UI patterns, existing design systems, or complex interaction requirements that generic dashboard builders simply can't accommodate.
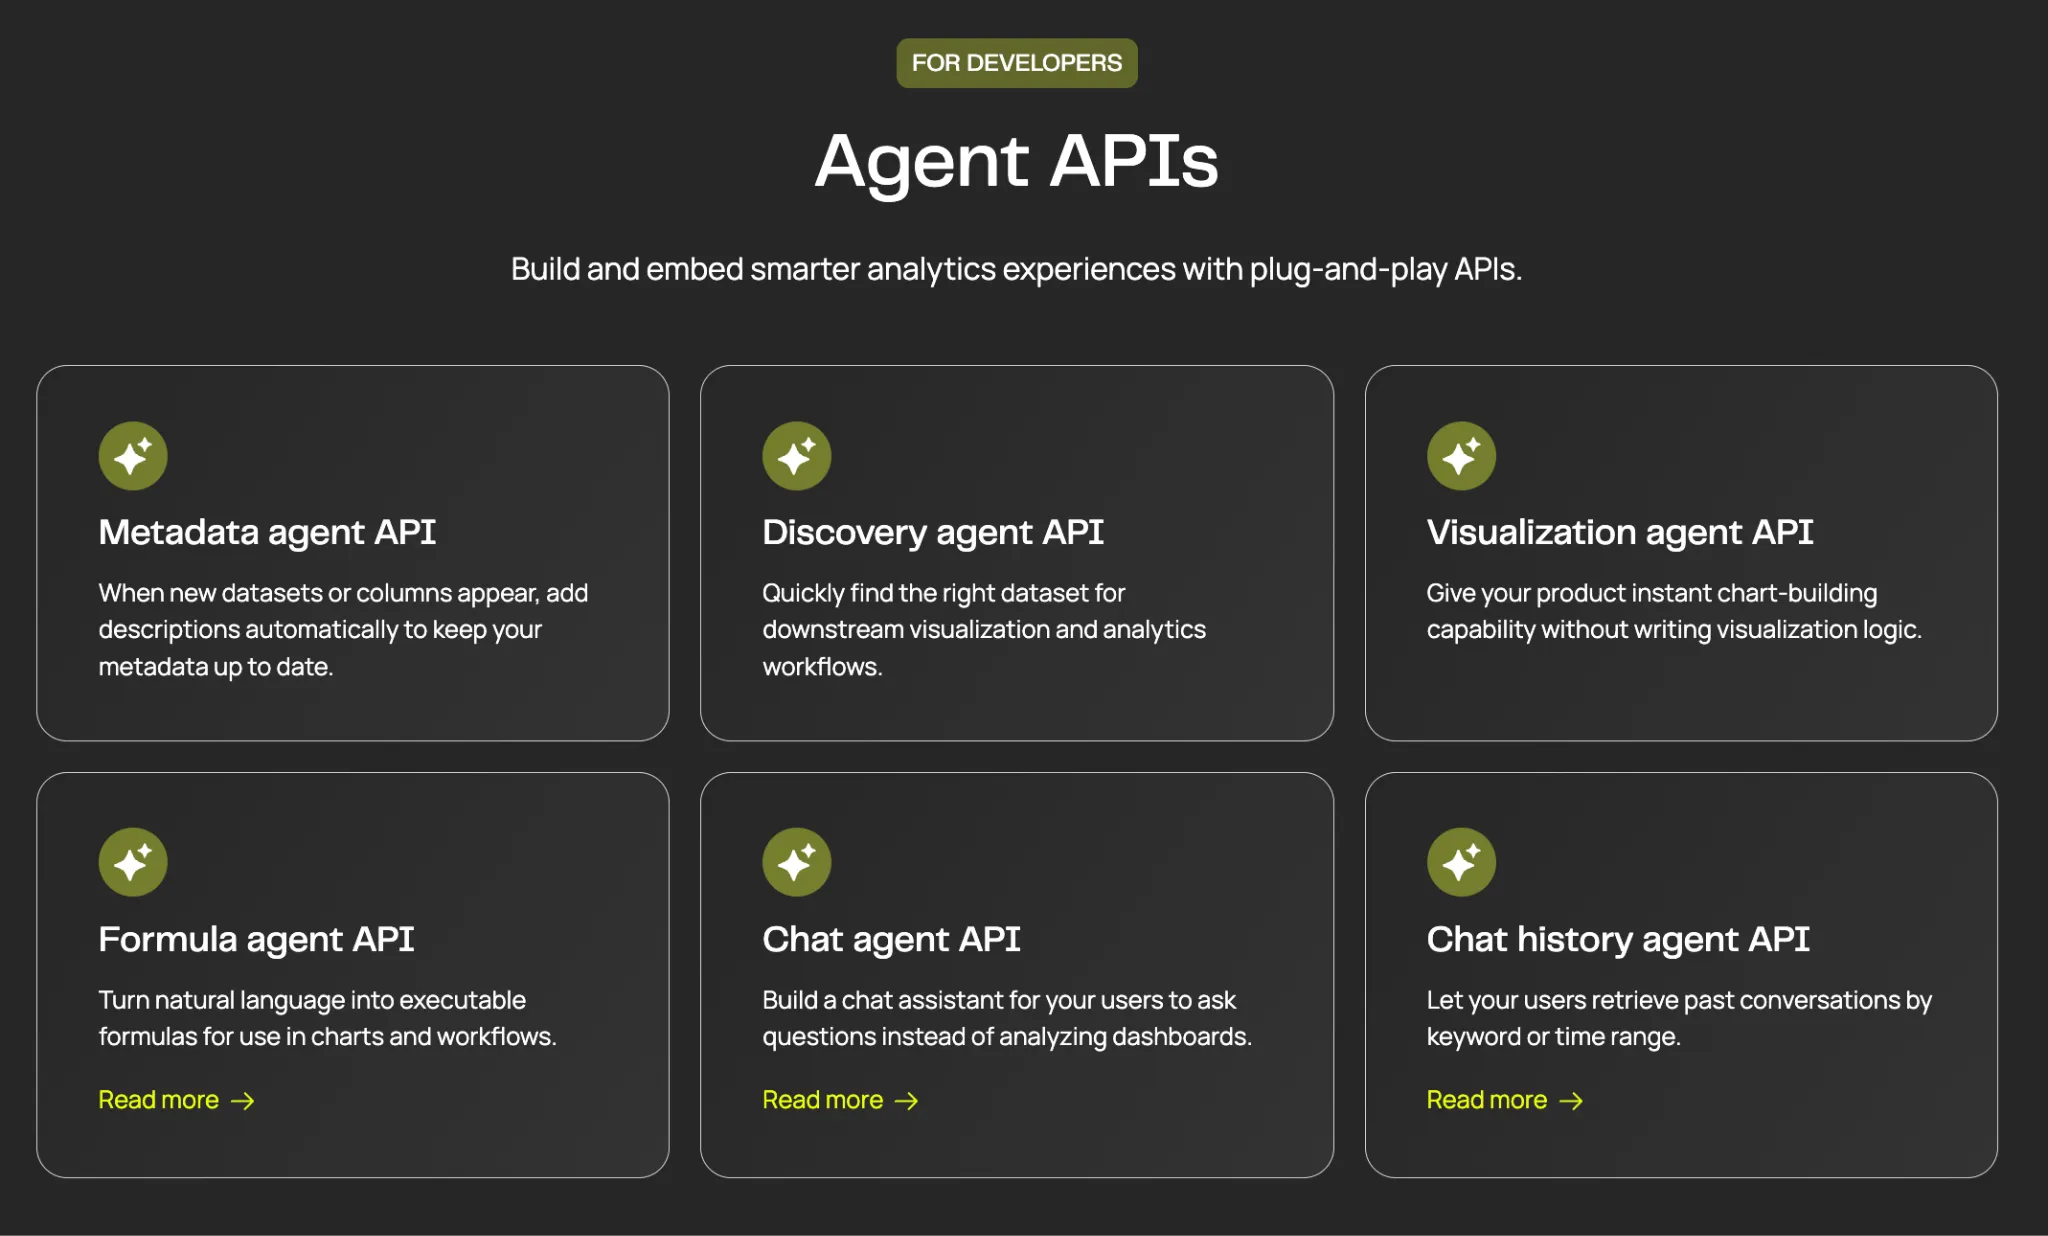
The Flex SDK takes this further: it exposes Luzmo's rendering and data layer as low-code building blocks, giving developers the ability to create fully custom data interactions without rebuilding analytics infrastructure from scratch.
Luzmo AI and Luzmo IQ: analytics that answers questions
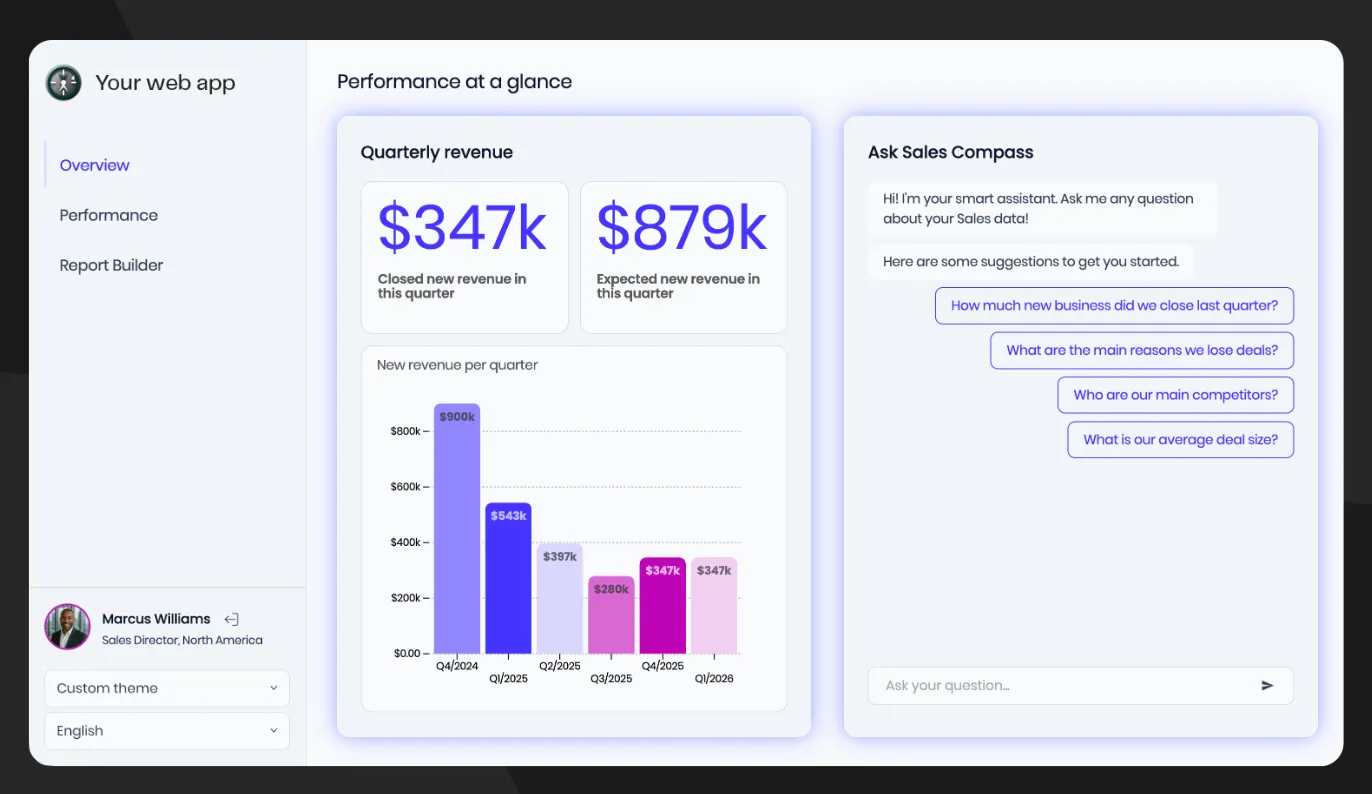
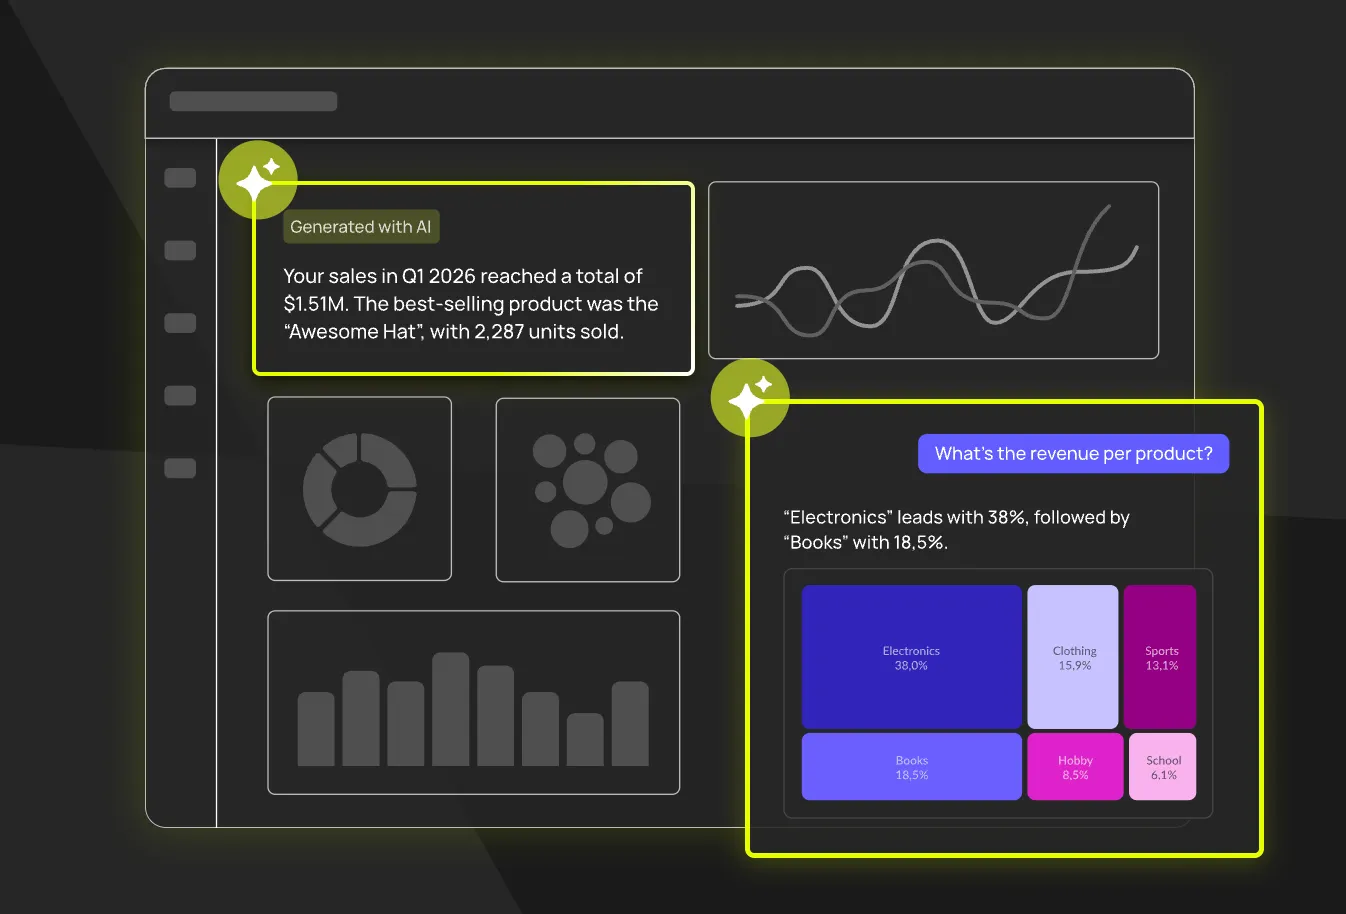
Luzmo's AI capabilities are embedded-first by design. Luzmo AI brings AI-powered insight generation, automated anomaly detection, and natural language querying across all of Luzmo's capabilities — not just as a standalone chat interface, but woven into the dashboard and exploration experience.
The flagship AI feature, Luzmo IQ, is a conversational AI analyst agent that sits inside your product. End users can ask questions in plain language and get accurate, governed answers — without leaving your application, without seeing your data stack, and without requiring any data literacy. This is meaningfully different from Omni's NLQ, which operates within the constraints of the internal semantic layer and is aimed primarily at analyst users.
Transparent pricing built for embedded scale
Omni's pricing is entirely sales-led, with no public plans — which makes it hard to model how costs will grow as your embedded user base expands before you've even had a sales conversation.
Luzmo publishes its plans and prices on monthly active users (MAUs) rather than provisioned seats, so your cost tracks the customers who actually use analytics each month — and you can see it upfront. For products with large or fluctuating end-user bases, that transparency and MAU basis make total cost of ownership far easier to predict than a sales-only quote.
Luzmo vs. Omni: side-by-side
The Luzmo compare page at luzmo.com/compare/omni covers every feature dimension in detail, including multi-tenancy, security, localization, and mobile responsiveness.
Best for
Software product teams building customer-facing analytics. Companies that need full white-labeling. Engineering-led teams who want SDK-level control. Any organization where the unit economics of per-viewer pricing are unsustainable.
2. Metabase
Metabase is one of the most widely deployed BI tools in the world, largely because its open-source version is free. The interface is genuinely beginner-friendly: you can connect a database and build a dashboard in under an hour without writing SQL. Non-technical users can query data using a point-and-click question builder, and the charting options cover most standard business intelligence needs.
For embedding, Metabase offers two modes: signed embeds (for public or semi-public content) and full-app embedding (for authenticated, multi-user product analytics). The latter is limited to Pro and Enterprise plans. Multi-tenant implementations are possible but require careful permissions architecture and more engineering work than purpose-built platforms.
The open-source foundation is both Metabase's biggest selling point and its main limitation. You can self-host for free, but product-grade embedded analytics – with SSO, row-level security, white-labeling, and tenant isolation – still requires significant engineering investment on top of the base product.
Best for: Teams with limited budgets who need basic internal BI. Developers who want to self-host and extend an open-source platform. Organizations that don't require sophisticated multi-tenancy.
3. Looker
Looker is the platform that Omni was explicitly designed to improve on – the Omni founding team came from Looker, and the products share DNA in their semantic layer approach. Looker remains the most mature LookML-based analytics platform available, with deep integration across the Google Cloud ecosystem (BigQuery, Vertex AI, Dataplex).
For enterprise teams already standardized on Google Cloud, Looker's semantic layer is genuinely powerful: centralized metric definitions, version-controlled data models, and robust governance. Embedded analytics is supported through Looker's Embed SDK and iFrame approach, and it can be made to work well – but it requires LookML expertise and careful administration. Looker has also added Gemini-powered conversational analytics and a Conversational Analytics API, so AI is no longer a gap.
The downsides are significant: Looker is expensive, administratively heavy, and carries a steep onboarding curve even for experienced data teams. It's also explicitly designed around internal BI use cases; customer-facing embedded analytics is achievable but not the primary design orientation.
Best for: Enterprise teams with in-house LookML skills, a Google Cloud center of gravity, and the resources to invest in platform administration.
4. Sigma Computing
Sigma Computing occupies an interesting niche: it's a cloud warehouse analytics tool built around a spreadsheet-style interface. Users interact with live data from Snowflake, BigQuery, or Redshift using formulas and pivot-table logic that feels familiar to anyone coming from Excel. The result is a tool that data analysts love – the analytical power of a cloud warehouse without having to learn SQL from scratch.
Sigma's embedding capabilities exist but are positioned as an add-on rather than a core product pillar. Its licensing is oriented around creators/analysts, so if you plan to embed at viewer scale it's worth confirming current pricing directly — costs can add up, and the embedding experience is geared toward analysts sharing dashboards rather than product teams delivering customer-facing analytics at scale.
Where Sigma excels is in live, exploratory analysis on large datasets. If your team lives in spreadsheets and needs direct warehouse access with a familiar interface, Sigma is genuinely excellent. If you need to embed that analysis into a multi-tenant SaaS product at viewer scale, it becomes a more complex and expensive proposition.
Best for: Data-heavy analytics teams who are comfortable in spreadsheets and need live warehouse querying. Less suited for customer-facing embedded analytics products.
5. GoodData
GoodData is one of the few platforms in this market that was purpose-built for embedded analytics – a meaningful distinction from tools like Looker and Sigma that adapted internal BI platforms for external delivery. Its multi-tenant architecture supports complex enterprise deployments, and its governance and security features (RBAC, row-level security, data access policies) are genuinely enterprise-grade.
The platform supports both managed cloud and self-hosted deployments, which matters for regulated industries or companies with strict data residency requirements. The analytics modeling layer is powerful but carries complexity – implementation typically requires a dedicated data engineering engagement, and time-to-value is measured in weeks rather than days.
GoodData is a strong choice for enterprises that need deployment flexibility, advanced governance, and are willing to invest in a substantial implementation project. For SaaS teams who need to move quickly, the overhead may be prohibitive.
Best for: Large enterprises in regulated industries. Organizations with strict data residency or deployment requirements. Teams with dedicated BI engineering capacity.
6. Holistics BI
Holistics takes a code-first approach to analytics: the semantic layer is defined in a modeling language rather than a GUI, making it appealing to data engineering teams who are comfortable with version-controlled, code-based workflows. It integrates cleanly with dbt and supports standard SQL without requiring a proprietary modeling language.
Transparent pricing is a genuine differentiator – Holistics publishes its plans publicly, starting with a platform fee plus per-user licensing. This makes it significantly easier to evaluate total cost without a sales conversation, which is increasingly rare in this category.
The embedding story is functional but lightweight: Holistics supports iframe embedding and some API-based delivery, but it isn't positioned as a full embedded analytics platform. For teams that primarily need BI with some external sharing capability, it works well. For SaaS teams building customer-facing analytics as a core product feature, the toolset is limiting.
Best for: SQL-first data engineering teams who want transparent pricing and code-based semantic modeling. Organizations with lighter embedding requirements.
7. Sisense
Sisense has repositioned itself around embedded analytics and its Compose SDK; a component-based embedding approach that gives frontend developers significant control over how analytics elements are rendered inside applications. This is different from iframe-based embedding: individual charts, filters, and KPIs can be embedded as independent components and integrated into a product's existing UI rather than delivered as a standalone dashboard.
The platform has strong governance, row-level security, and a mature feature set built up over years of enterprise deployments. It handles large datasets well and supports complex data models. Sisense's Fusion product also includes AI-powered analytics capabilities.
The main friction points are plan structure and pricing. Entry-level plans have meaningful limitations (single environment, view-only embedding), and self-serve plus white-label features typically require higher-tier plans. Cost can escalate quickly for SaaS teams building at scale, and implementation complexity is higher than lighter-weight alternatives.
Best for: Developer-led teams that want component-level embedding control. Organizations with existing Sisense relationships or who need deep front-end customization of individual analytics elements.
How to choose the right Omni alternative
The right alternative depends almost entirely on what you're building analytics for.
The internal BI vs. embedded analytics distinction isn't a feature difference – it's an architectural orientation that affects pricing, scalability, white-labeling, multi-tenancy, and developer experience across the entire platform.
Use this as a starting framework:
- Building customer-facing embedded analytics as a core product feature? → Luzmo. Luzmo wins on speed, SDK depth, and AI capabilities.
- Need transparent pricing without a sales conversation? → Luzmo publishes plans publicly and offers meaningful low-cost tiers for evaluation.
- Want AI-powered analytics embedded directly in your product? → Luzmo IQ is a purpose-built conversational AI for customer-facing analytics. Omni's NLQ is better suited to internal analyst workflows.
The bottom line
Omni Analytics is a well-built BI tool that works best for internal data teams who want a modern Looker alternative. But if your roadmap includes analytics inside your product – dashboards your customers interact with, self-service exploration, AI-powered insights delivered at viewer scale – Omni's architecture isn't designed for that job.
Luzmo is. It was built from the ground up for SaaS teams who need embedded analytics that disappears into their product, self-service that scales to thousands of non-technical users, and AI-powered querying grounded in governed data – all under a pricing model that doesn't penalize you for growing.
→ See how Luzmo compares to Omni, or start a free trial today.
Written by

Ship the future of your data
Let us show you what Luzmo can do for your product.

Leave your e-mail and one of our analytics experts will reach out to you