10 Best Self Service Analytics Tools for Actionable Insights

Self-service analytics is like having access to a great cookbook. In the right hands, it can lead to a table full of delicacies. In incompetent hands, it results in an uneatable mess. Knowing how to use self-service analytics can lead to more informed business users and ultimately, more revenue. But it all starts with the right tool.
There are countless BI tools for self-service analytics, all of them promising real-time, actionable insights, machine learning, natural language features, and data democratization. But how do you choose one that delivers on its promises?
Today, we help you choose the right BI platform for self-service use cases.
What features should a self-service business intelligence tool have?
A self-service BI tool should do a lot more than just create dashboards from finished datasets. If you already have a BI tool, or even if you’ve never used one before, here are some of the must-haves in your self-service analytics app.
Easy embedding
Before your end-users get access to a data visualization, your developers have to embed the dashboard in your SaaS product. Some of them are intuitive for your developers and have great APIs for easy embedding. You can also use iframes and SDKs to make the embedding workflow easier.
While this may not seem like a huge consideration, it can make a difference between a job that takes several hours and several weeks. Not only that, but you may have to hire additional data scientists, developers, and engineers for setup and maintenance.
A variety of data sources on the analytics platform
To make the job easier for your data analysts, choose a self-service app that connects to your most used data sources and integrations. For example:
- A data warehouse
- An ETL tool
- Business tools such as CRMs
- Systems tools such as Excel, Airtable, and others
While much of the work can be done through API access, having native access to the most important data sources can cut significant costs and time investments early on.
Ease of use (for the end user)
The aim of self-service analytics is to make decision-making easier for non-technical users. The only way they can get the most out of interactive data analytics is to understand what is even going on. The business user should be able to drill down into data and explore it, without any knowledge of data science.
To ensure this, choose a tool that comes with a wide range of dashboard templates, a great knowledge base, and helpful customer support. Ideally, the tool should have a drag-and-drop builder, allowing the user to tinker with the KPIs, metrics and widgets without requiring expert help.
A variety of visualizations
The self-service analytics solution should offer a wide range of visualizations for a variety of use cases. Even the best analytics capabilities won’t matter if you can’t create the graphs you need for a specific situation.
Some tools such as Microsoft’s Power BI or Looker excel in this area, with a variety of graphs, charts, scatter plots, histograms, and many other visualization types. Consider your most common scenarios and the visualizations you need when choosing a self-serve analytics solution.
Cost and licensing
Enterprise BI tools are incredibly powerful, but this is reflected in the pricing. Self-service analytics can cost over $100,000 annually so make sure to carefully consider the costs of implementation, licenses, and monthly usage.
Most BI tools don’t have transparent pricing and you’ll have to talk to sales teams to find out how much it costs for your own unique situation.
Data security and governance
If you’re considering offering self-service analytics as part of your software application, the BI tool you choose should have strong security measures to prevent data leaks. The data at risk is not just the data from your app, but also from your end users.
On top of that, it should have user access controls to separate users who have view and edit access to the datasets and visualizations.
Last but not least, having access to audit trails can make life easier for the end user. Should something go wrong, they can simply trace their steps and fix it without calling the IT team.
The best self-service analytics tools for SaaS products
Now that you know the features you need from a self-service analytics platform, let’s explore some of the best choices for SaaS vendors in 2024 and beyond.
Luzmo
Advanced analytics, easy data discovery and fair pricing? Luzmo is the right choice for SaaS product teams looking to add a dashboard to their app while making both the developers and the end-users happy.
Luzmo connects to your most used data warehouses and business tools thanks to our user-friendly API. Embedding dashboards is a matter of a few hours and requires nothing but a handy developer on your team.
There are a variety of dashboard templates and visualizations available, all in an easy drag-and-drop interface. With Luzmo, data literacy is one dashboard away.
We also offer embedded analytics editors, which allow your end users to make their own dashboards from scratch. Data exploration and predictive analytics are easy, thanks to templates and an easy-to-use interface.
Perhaps the best part is that you know exactly what you’re going to pay. Luzmo pricing starts at $995 per month and you can get a free trial today!
Looker
Looking to do complex data analysis and get amazing visualizations in the end? Google’s Looker is one of the best cloud-based enterprise data analytics tools. Whether you start with raw data or fully modeled datasets, you can do extensive data exploration thanks to LookML, Looker’s version of SQL.
The only downsides to Looker for embedded analytics that we can highlight are the fact that Looker is very expensive and you really need a team of specialists to make it all work properly. Without someone proficient in Looker on your team, you’ll struggle to create user-friendly dashboards for your end users.
Sisense
Sisense is built for self-service analytics, which in theory means that setting up dashboards in your app is easier compared to some other enterprise-level tools. There are indeed multiple ways to embed dashboards and they are fairly easy.
However, customization in Sisense requires a fair bit of tinkering, which is where an expert developer or two might be necessary. It’s also prohibitively expensive for most teams, as it will run you at the very least $10-20,000 per year to get started with Sisense.
Power BI
Power BI for embedded analytics carries some similarities with the desktop version of the tool, but the great news is that dashboard viewers won’t need a license to access them. It’s a popular tool and there are many resources available online if you get stuck with data preparation, analysis or configuring dashboards.
This is great news because Power BI is not easy to use and will require someone knowledgeable with prior experience with this tool. Figuring out the pricing is not easy either, so it’s best to get in touch with sales to get an estimation of your annual costs.
Tableau
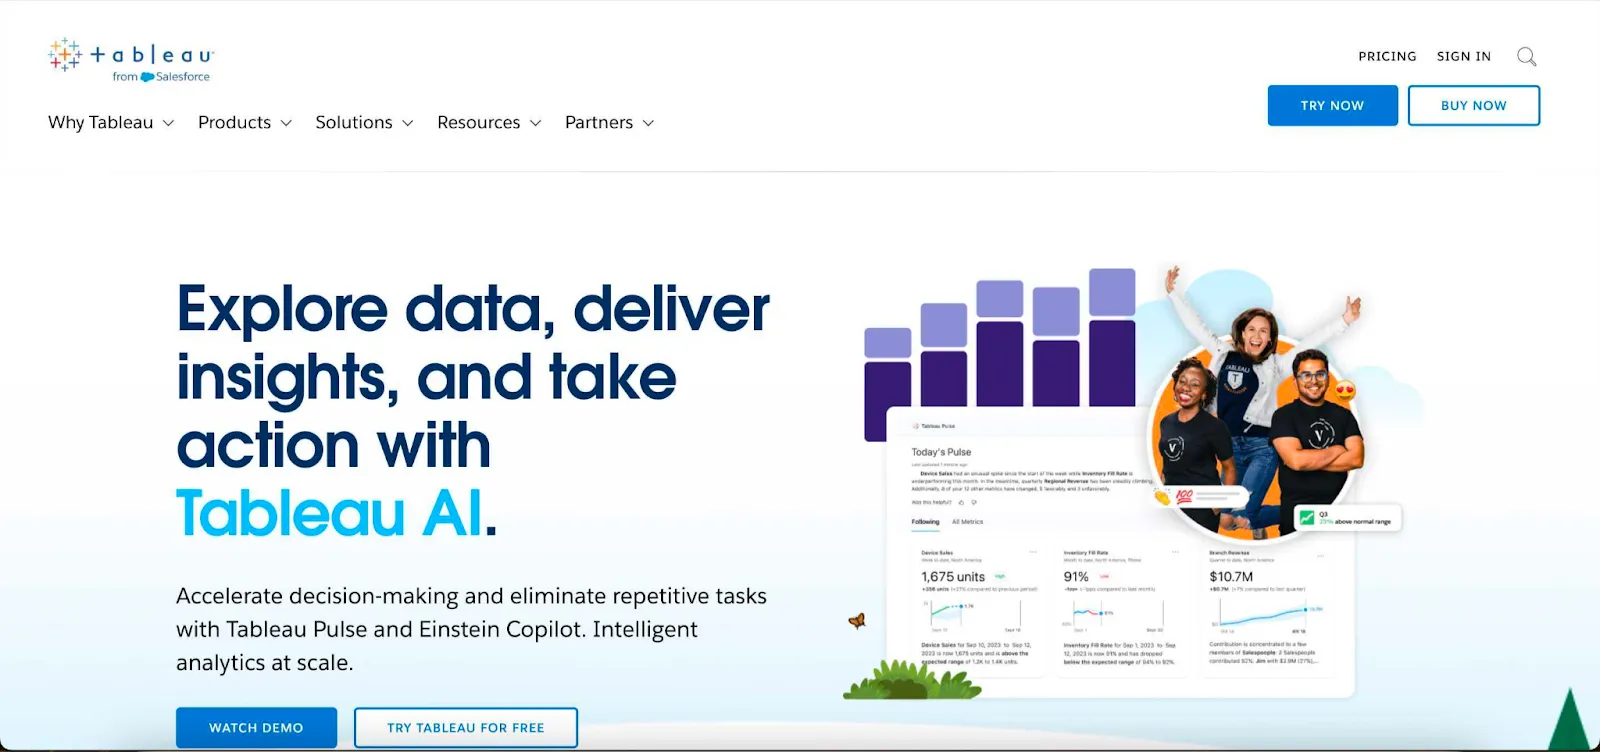
Tableau for embedded analytics comes with some of the benefits of using Tableau for internal reporting. Primarily, you get great data visualizations and ease of use - creating a dashboard is fairly simple.
If you want just the basic Tableau features, it’s a great choice for your team and business users. But as many reviews show, anything that requires slight customization can result in hours upon hours of work. Pricing depends on many factors, and it’s best to talk to the Tableau team. For reference, the basic embedded analytics package will cost you upwards of $4,000 per month.
Domo
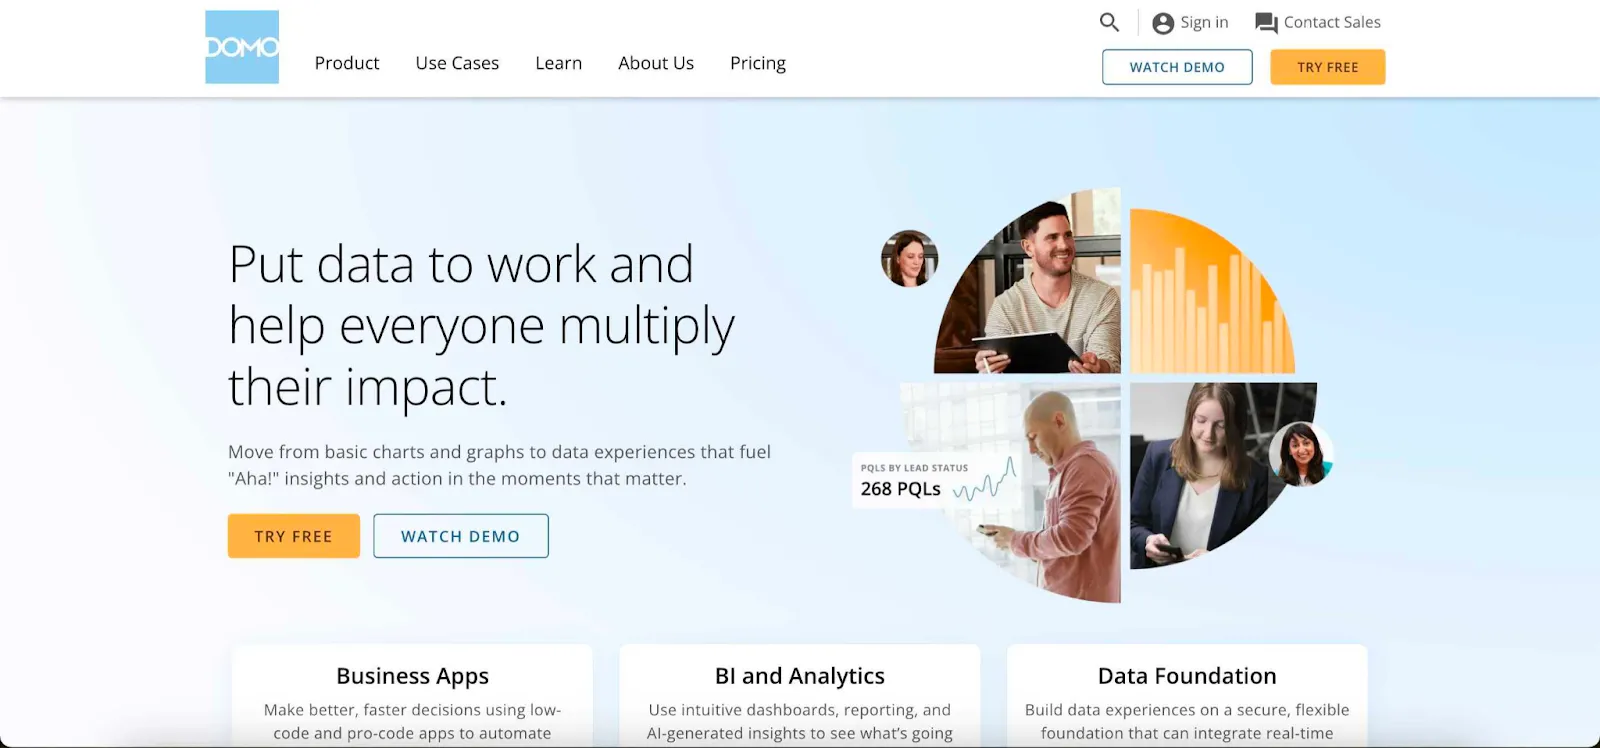
Domo is a superb choice for data teams that need a variety of data integration capabilities: there are hundreds to choose from. The same goes for dashboards, as anyone with a basic knowledge of SQL can create and customize them.
As for the downside, the learning curve can be very steep if you want to master any of the more advanced features. Pricing is not transparent and can easily go into thousands of dollars per month if you use the included Domo data warehouse and other associated tools.
Alteryx
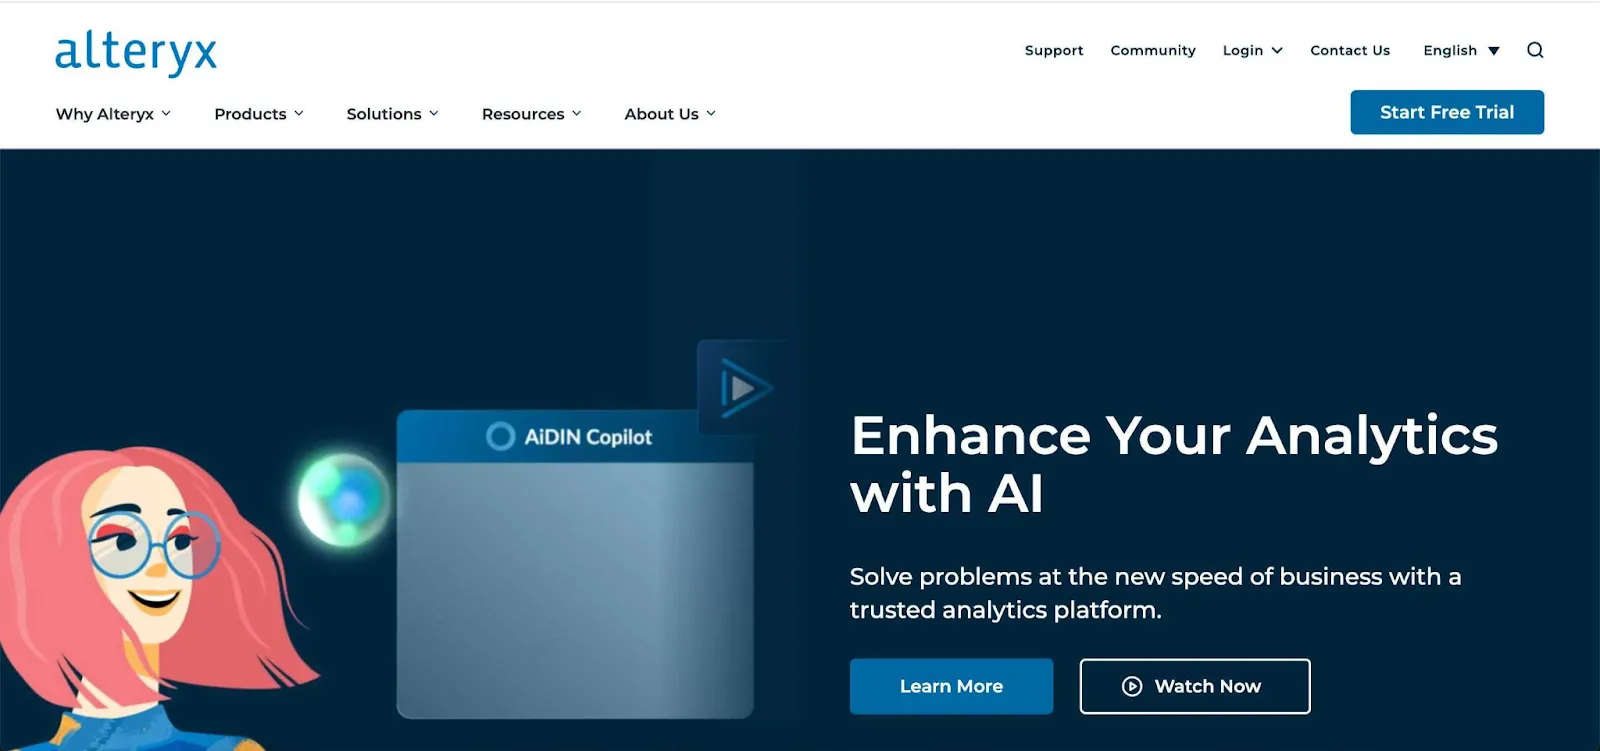
Alteryx is a no-code data analytics platform that is known for its user-friendly interface, easy data preparation and blending, and reusable workflows. If you’re looking outside of the typical BI choices, this can be a great way to move up from Excel to more advanced data analytics.
The downside is that it can be used only to connect, analyze, prepare, and model your data, but not visualize it. To do this, you’ll need an additional tool which already adds up to the extensive Alteryx costs of $4,950 per user per year.
Qlik Sense
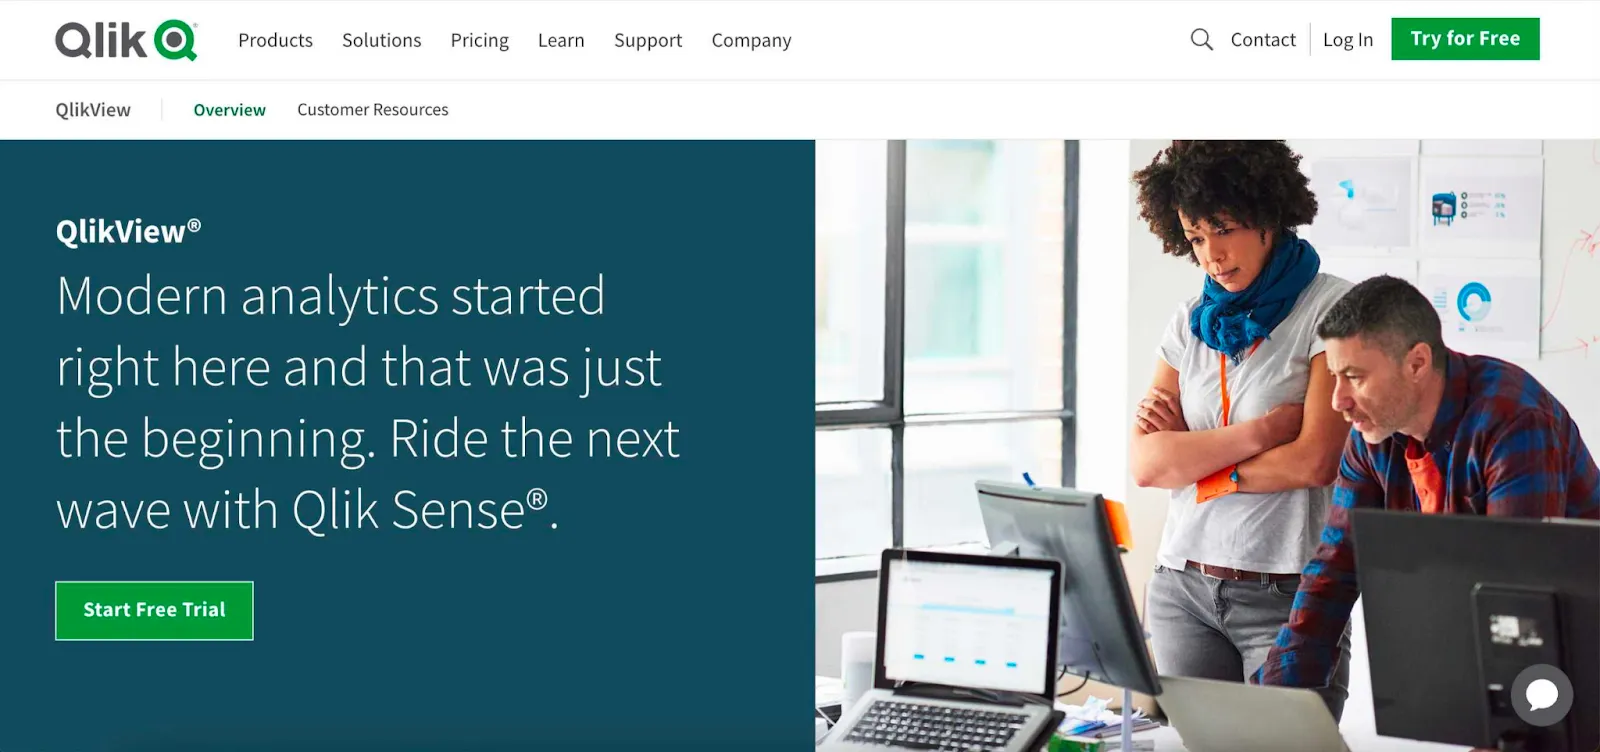
Qlik for embedded analytics is known for its great user interface and real-time insights. It comes with a generous selection of data connectors, data sources, and templates. Couple this with natural language queries as a way to explore data, and Qlik is a promising entry into the world of self-service BI.
As for the downsides, many users complain about the lack of customization options. Also, pricing can be complex and not cheap by any means: $2,700 is the starting point per month.
Keboola
If you’re looking for a low-code/no-code entry in the world of data analytics, Keboola is one of the best choices. It can help you automate ETL pipelines, and create data analytics workflows and data catalogs, and it’s GDPR and HIPAA-compliant.
Similarly to Alteryx, it does not come with data visualization capabilities, so you’ll have to connect a different tool to get access to dashboards and reports. It has a free tier that gives you 120 minutes of computational time per month, while paid plans are not displayed publicly - you have to get in touch to learn more.
Pyramid Analytics
Pyramid Analytics is a popular choice for companies that want to blend data analytics with artificial intelligence and help end users get to insights faster with AI. To achieve this, you can use something called Smart Insights and Chat Bots, allowing end users to ask questions about their data.
Users complain that the platform can get pretty buggy and has a steep learning curve for new users. However, the customer support team can help out if you get stuck. There is no publicly available pricing.
Conclusion
Having access to interactive visualizations can help all the stakeholders in your business understand data and make better business decisions. But while your intentions may be good, you could jeopardize the entire operation by choosing the wrong kind of tool. With our tips and lineup today, you can make a more informed decision about your next self-service data analytics tool.
But why worry about making the right choice when Luzmo has it all? Easy embedding, tight security, a wide choice of connectors and visualizations, and to top it off, transparent pricing.
Sign up for a free demo to learn more about Luzmo’s self-service analytics!
Written by

Ship the future of your data
Let us show you what Luzmo can do for your product.

Leave your e-mail and one of our analytics experts will reach out to you