 ChatGPT
 Perplexity
.png)
.png)
.png)
Build your first embedded data product now. Talk to our product experts for a guided demo or get your hands dirty with a free 10-day trial.

.png)
If you’re looking at your product roadmap for 2026 and considering what to add to provide value to your customers and improve your bottom line, embedded analytics is a logical choice. You can give customers more control over their data, enable end-user analytics so they can create their own dashboards, and unlock expansion revenue by charging more for data visualizations.
There’s just one small problem: you may feel like your product is not yet at the point where it could use embedded analytics. You may think that you don’t have the technical foundation, the interest, or the resources to add embedded dashboards to your SaaS tool.
This is why we’re here today: to show you if you’re truly ready to add embedded dashboards to your SaaS platform.
Here’s a list of eight clear-cut signs that you’re perfectly ready to add embedded BI to your SaaS.
If your product is a CRM, it’s only natural that businesses will want actionable insights to make smarter decisions. For example, who their top-performing sales reps are, which channels bring in leads with the highest ARR, or which outbound emails get the best reply rates. And you can build these out yourself, but it’s not a viable solution in the long run.
The more customers you have, the more requests will keep coming in for reports, data exports, or dashboards. If you have an in-house data analytics team, this workload is on their shoulders.
A dashboard or report once in a while may seem okay, but as these requests start piling up, you’ll run into a time issue. If engineers are busy delivering dashboards, they won’t have time to work on your core product and features. Everything suffers, from your roadmap to your engineers and other customers.
When your product already captures meaningful data, but users still make decisions elsewhere, there is a clear gap between value creation and value delivery.
Most SaaS products quietly accumulate rich signals over time. Usage patterns, transactions, workflow events, response times, outcomes, and historical trends often live in the database but never surface in a way that helps users act.
Instead, teams export data to spreadsheets, pull reports into BI tools, or rely on gut feeling because insight is not available at the moment it matters.
This becomes a problem once data starts influencing real decisions. Pricing changes, staffing levels, campaign adjustments, risk assessment, or customer prioritization all depend on understanding what is happening inside the product.
If users must leave the app to answer those questions, friction slows decisions and reduces confidence in the data.
Embedded analytics closes that gap by placing insight directly next to the action it informs. A user reviewing an account can see trends tied to that account. A manager planning resources can see workload patterns without switching context. The data is the same, but the timing and placement change how it is used.
There is also a trust factor. When insights come straight from the product that generates the data, users are more likely to rely on them. No stale exports. No manual interpretation. Just current information presented in a way that matches how decisions are actually made.
If your customers already depend on your data to run part of their business, but your product does not yet help them interpret it in context, that is a strong signal that you are ready for embedded analytics.
As soon as a product is used by more than one role, a single dashboard stops working.
An executive might want high-level trends and comparisons over time. A manager often cares about team performance, bottlenecks, and progress against targets. Individual users usually want detailed, task-level, or account-level data that helps them act right away. Trying to force all of this into one view leads to clutter, confusion, and constant customization requests.
This is where embedded analytics becomes more than reporting. Role-aware analytics lets each user see data that matches their responsibilities, permissions, and level of context. The same underlying dataset can answer very different questions depending on who is logged in, without duplicating logic or building separate tools.
It also matters for access control. Different roles often require different visibility, especially in multi-tenant products. Embedded analytics allows you to apply the same permission model used elsewhere in your app, so users only see what they are allowed to see, down to row level or account level.
From a product perspective, role-based analytics reduces roadmap tension.
Instead of building custom dashboards for every persona, you define a flexible framework where views, filters, and metrics adapt automatically. This keeps analytics aligned with how your product already handles users, teams, and organizations, while giving each role answers that feel purpose-built rather than generic.
By the time a customer asks for a report or a dashboard in your product, there’s a high likelihood they’ve already tried to create it themselves. Think about it: asking the company that makes the product for a piece of data is not very efficient. It means writing up a ticket, submitting it through a channel such as email or live chat, and hoping for a quick response. In the best-case scenario, there’s a 24-hour turnaround time.
It’s much more efficient to simply give them the keys so they can generate their own reports and dashboards. You’ll achieve higher customer satisfaction and decrease the workload on your engineering team.
Internal dashboards can afford compromises. You can build them so they’re rough around the edges, as the target audience (your own team) just needs to see the data. When it comes to end users, the stakes are much higher.
Your end-users are comparing you against the tools they use every day. They’re not using Power BI for internal sales forecasting. Instead, they’re using TikTok, and they want similar UI and UX, even when it comes to dashboards.
If your product’s roadmap revolves around customer-facing features targeted towards end-users, embedded analytics is the logical next step. But just adding a dashboard is not enough either, as there are additional steps involved.
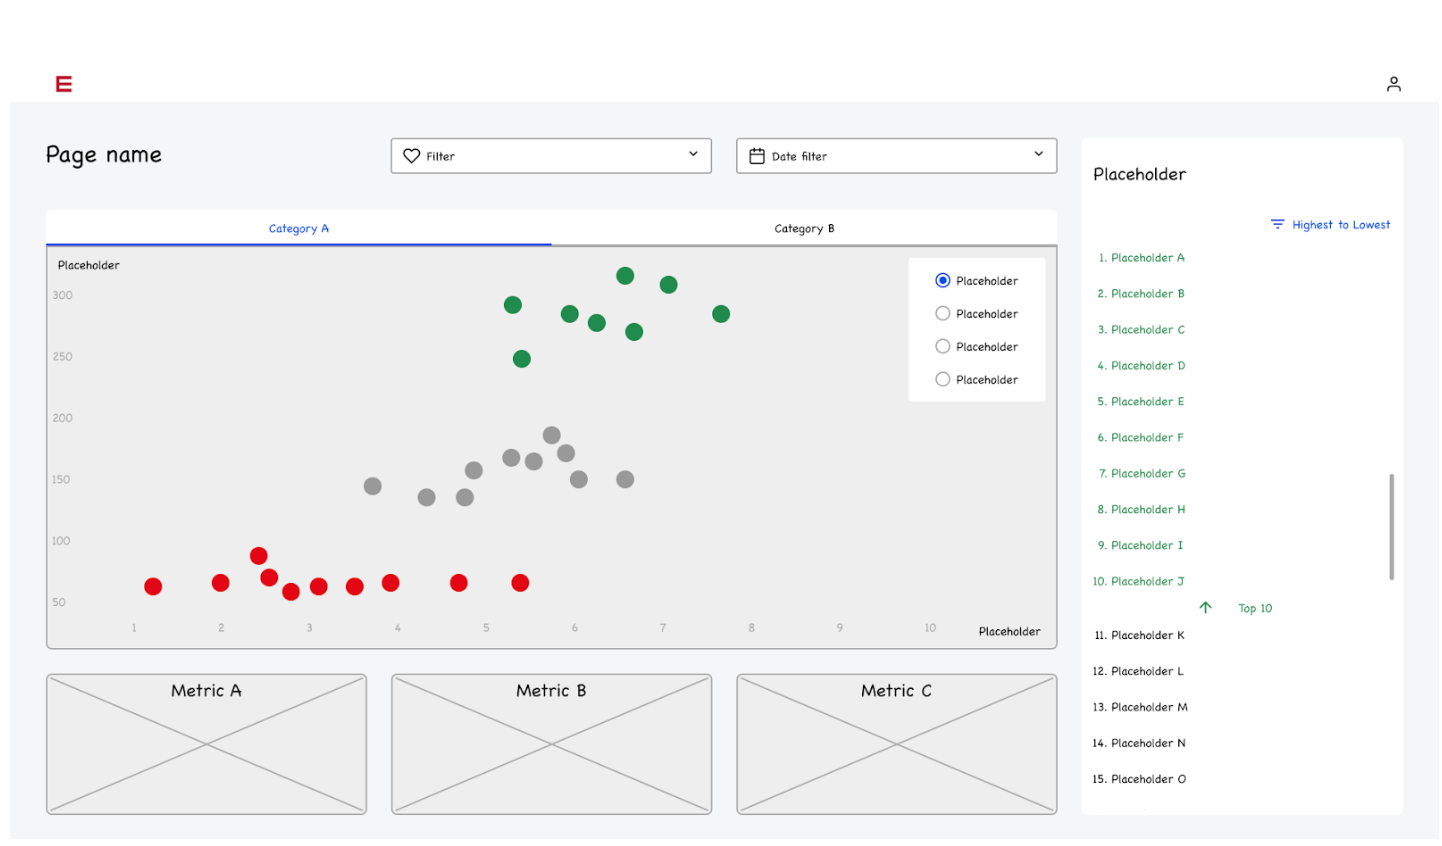
Your dashboard should convey the basic data points through attractive data visualizations, but that’s just the bare minimum. To truly embed dashboards into a website or an app, there are many other conditions you should meet. For example:
Traditional BI tools are simply not enough to meet these requirements. Despite being extremely powerful for internal reporting, Power BI, Tableau, or Looker won’t be easy to set up and configure for fast loading, white-label customization, and ease of use.
Embedded analytics is not just another feature set on your roadmap. When built and shipped correctly, it’s an excellent boost for your revenue. You can add analytics as an add-on to all plans and change the pricing or simply include it in some plan to upsell users.
For example, dashboards and detailed analytics are available in Shopify’s Advanced plan. If you want more details and sales data, you have to upgrade.
In the early days of adopting embedded analytics, you can use upselling to pay off the costs for your embedded analytics platform (or development work). After a short time period, embedded analytics not only pays for itself but also brings in additional revenue on autopilot.
If analytics capabilities keep popping up in sales calls when leads compare you to competitors, it’s a clear sign that this is a differentiator that you can’t afford to miss out on.
Embedded analytics is not a new concept, and thanks to no-code platforms that are easy to integrate and set up, an increasing number of SaaS businesses are adding data visualizations to their tools.
It’s no longer an issue of technical implementation, since modern embedded BI tools come with SDKs and APIs. It’s also not a cash problem since tools like Luzmo come with transparent pricing, and you won’t be hit with a $100k/year contract.
If your discovery calls are filled with customers asking to add embedded dashboards so that end-users can get more data-driven insights, you need to add this feature set to your SaaS tool. Otherwise, you may be losing new customers (and risking churn) because a competitor is quicker to recognize the market shift.
If you’re still wondering whether embedded analytics is the right choice for you, it boils down to one question: what’s stopping you from using it right now?
It could be an issue of technical complexity, replacing a legacy BI platform, customization issues, the potential costs, or something else. Once you know what the blockers are, and you go through the signs above, you’ll have a clear answer on whether your product is embedded BI-ready.
The good news is that we can answer many of these questions for you. At Luzmo, we have almost a decade of experience building embedded analytics experiences for products like yours, and we’ve seen it all.
Book a demo with us today to find out how you can start using embedded analytics in your product within days, not weeks or months.

All your questions answered.
Build your first embedded data product now. Talk to our product experts for a guided demo or get your hands dirty with a free 10-day trial.


