 ChatGPT
 Perplexity
.png)
.png)
.png)
Build your first embedded data product now. Talk to our product experts for a guided demo or get your hands dirty with a free 10-day trial.

.png)
Up until recently, embedded analytics was another nice-to-have on every product manager's list. Sure, there were plenty of benefits, but it came with a lot of downsides too. Building embedded analytics in-house required a significant amount of work with uncertain results.
Nowadays, embedded analytics tools help any SaaS team improve the user experience with data visualizations in a matter of hours, not weeks or months. The market is booming with separate analytics tools such as Luzmo, as well as traditional business intelligence platforms like Tableau that let you embed their dashboards.
But just saying you'll "do embedded analytics" opens up another can of worms. You definitely want to create data visualizations to provide actionable insights, but that's like saying you'll use a knife to cut stuff.
Today, we show you how specifically you can use embedded analytics tools to analyze data, connect data sources, and give actionable data insights to your team or customers.
Embedded analytics platforms are tools used to connect data sources, aggregate and visualize data, and then share those data visualizations in an embedded setting. Typically, this is within a SaaS app or your own website when you want to show data-driven insights to your team.

A standalone embedded analytics platform such as Luzmo is built for embedding from the start, unlike traditional BI tools that were meant to do internal reporting and have embedding as an add-on.
Primarily, embedded analytics platforms are:
Essentially, the best embedded analytics platforms allow product and development teams to bring a beautiful and functional analytics experience, whether it's to your team or your customers.
Before we get into practical ways to use embedded analytics tools, let's show you a few more reasons why embedded analytics tools simply make sense for SaaS.
Using an embedded analytics platform gives teams a simple way to turn raw data into something customers actually understand. Instead of switching between tools or exporting spreadsheets, people see key insights right inside the product they already use every day.
One major benefit is the improved experience for customers who rely on data to make decisions. Clear charts and dashboards inside your SaaS reduce confusion, increase trust, and make it easier for users to get value from your product.
Another important advantage is that embedded analytics helps product teams stay focused on their core features. Instead of spending months building charts, query engines, caching layers, or access controls, you can plug in a ready platform and ship polished visualizations quickly.
It also creates new opportunities for product growth and new revenue streams. Many SaaS companies use embedded dashboards to introduce premium analytics features, sell higher-tier plans through expansion revenue, or add dedicated reporting modules for power users.
Finally, embedded analytics reduces friction for internal teams. Support, sales, and customer success can reference the same real-time data that customers see. This cuts down on back-and-forth conversations and helps your team respond with clarity since everyone has access to the same key features and analytics capabilities.
All together, embedded analytics gives SaaS companies a faster path to useful reporting that feels native to the product and supports long-term growth.
We covered the basics, now let's show you how you can use embedded analytics to provide a superior user experience and give customers actionable insights in your app.
A regional tourism agency wanted to help visitors choose the best time to visit beaches and coastal areas, especially during peak seasons. They worked with a telecom partner to use anonymized mobile network data and turned it into clear, easy-to-read dashboards with an embedded analytics platform.
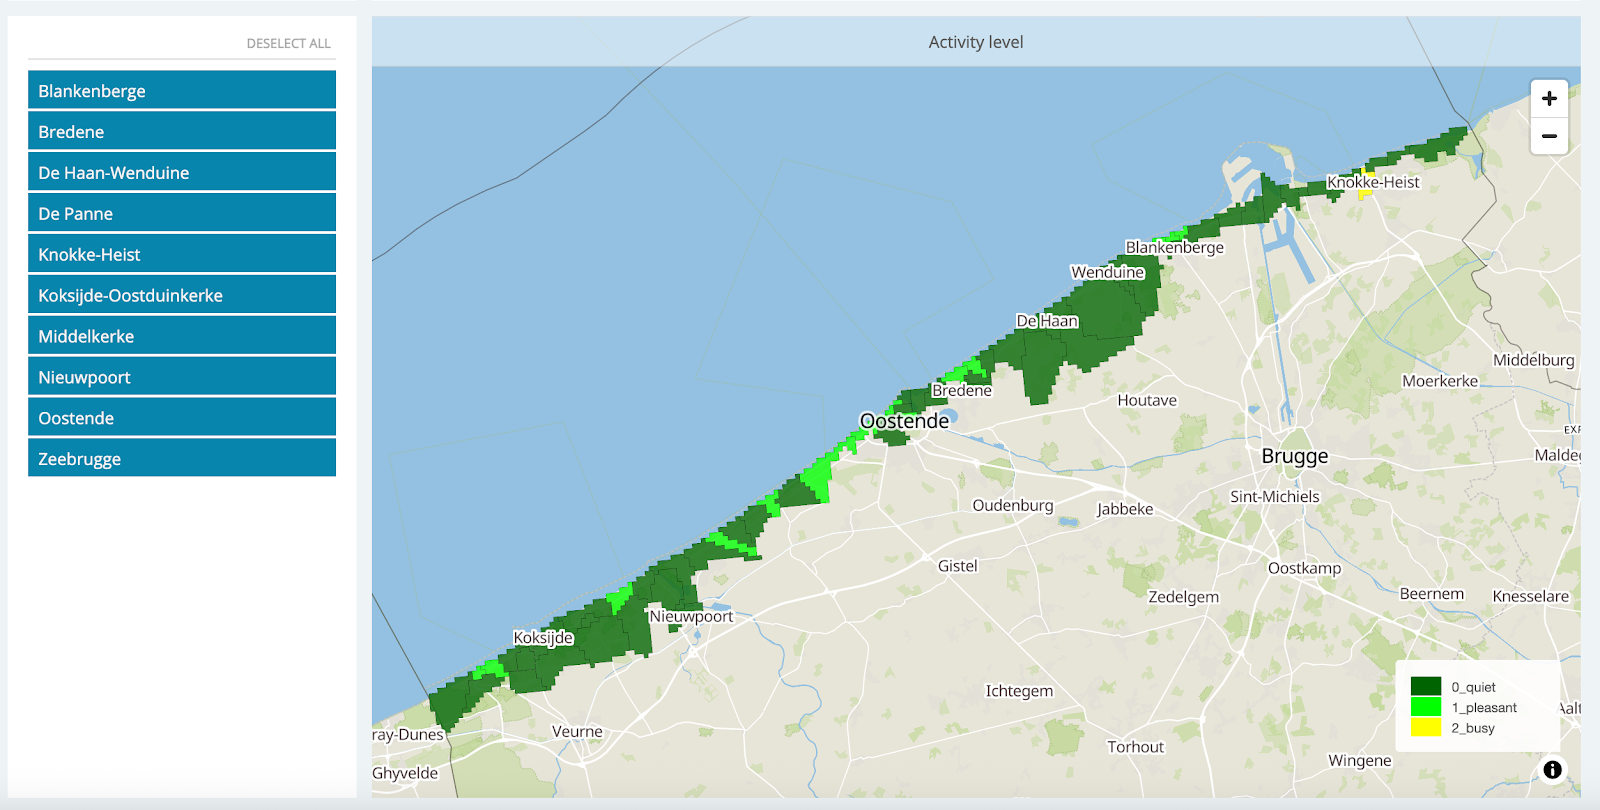
The dashboards update every fifteen minutes and show whether a location is quiet, pleasant, busy, or very crowded. Visitors can check the map before leaving home and decide where to go based on live conditions. This reduces frustration, spreads foot traffic across multiple destinations, and improves the overall experience for tourists, all the while protecting sensitive data.
The same visualizations help internal teams, too. Policymakers and operations staff track peak hours, busy zones, and train occupancy in real time. This lets them plan services, adjust resources, and manage crowd flow with confidence.
By embedding the analytics directly into their public website, the agency avoided a complex in-house build and delivered a simple feature that users immediately understand. What started as a safety measure during a crisis has become a long-term tool for smarter destination management.
Fleet Perfection needed a way to increase visibility into its fleet asset valuation processes and make faster, smarter sales decisions. By embedding an analytics solution from Luzmo, the company gained real-time dashboards coupled with predictive insights that ultimately sped up vehicle sales by 30%.
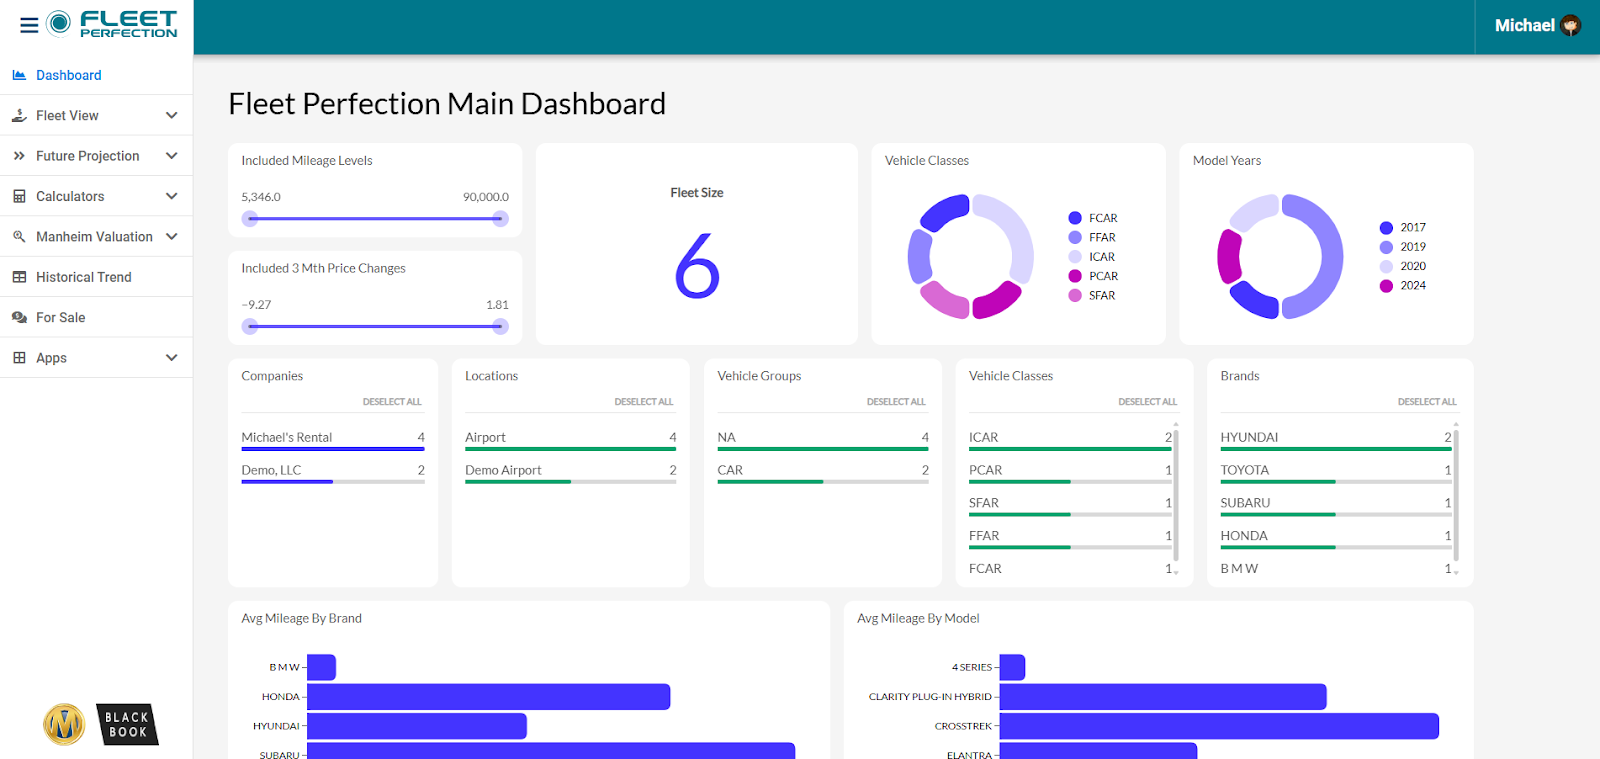
With the new analytics layer integrated directly into their platform, Fleet Perfection’s team could monitor inventory status, view market trends, and identify undervalued vehicles at a glance.
Instead of relying on static spreadsheets and delayed reports, the dashboards provided immediate visibility into valuation gaps and sales opportunities. This meant the company could act quickly when market timing was optimal and reduce the time vehicles sat unsold.
By shifting from manual reporting to embedded analytics, Fleet Perfection not only improved internal workflows but also delivered a more transparent experience to its dealer and rental company clients. The result: stronger market positioning, operational scale, and faster conversion of fleet assets into revenue.
Lansweeper, a leader in technology asset intelligence, faced a bottleneck: building dashboards and reporting in-house was taking so long that customers were frustrated and the engineering team was tied up.
By integrating Luzmo, Lansweeper moved from scratch-built analytics to a full-featured embedded solution in weeks. Their customers got immediate access to interactive dashboards inside the application, and the Lansweeper team freed engineers to focus on core capabilities.
Rather than directing users out to external BI tools, visualizations appear where they already work: on asset pages, and workflows. This “analytics in context” approach drives higher engagement and faster adoption.
Ultimately, the switch improved delivery speed, amplified user satisfaction (their beta NPS rose sharply), and positioned Lansweeper for future growth by leveraging built-in analytics rather than building everything themselves.
Katana, a cloud-based inventory management platform for small and mid-sized businesses, faced a growing demand from users for faster and more flexible access to data.
Instead of relying on static dashboards and manual reports, Katana wanted to enable its customers to ask data questions and receive visual insights instantly.
To meet that need, Katana partnered with Luzmo, embedding its analytics platform into the product. The integration allows users to ask natural-language queries, which are turned into charts and graphs in real time, all within Katana’s interface.
Katana maintained full control of the user experience, branding, and chat interface, while Luzmo handled the analytics infrastructure.
The result is a self-service data exploration feature that empowers Katana’s end-users to uncover insights without leaving the application or depending on spreadsheets. With this upgrade, Katana moved from dashboards as static deliverables to dynamic, user-driven exploration.
Element Logic, a Norwegian platform specializing in automated warehouse solutions, was struggling with rigid dashboard tools that limited design flexibility and user experience.
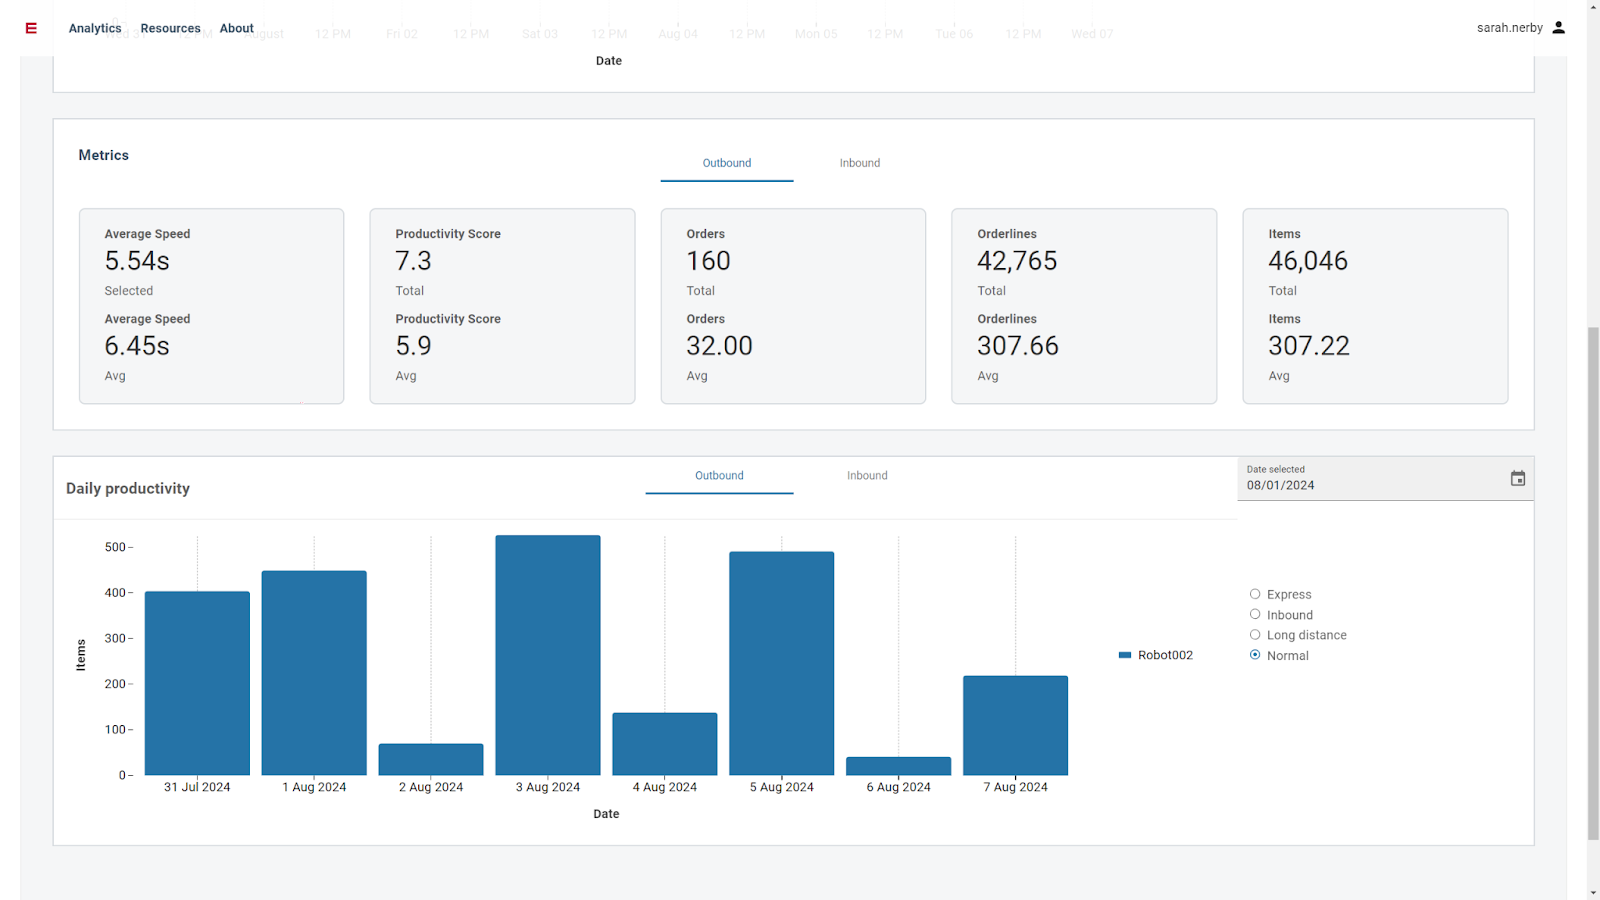
They partnered with Luzmo Flex SDK to give their analytics dashboards an upgrade. Within a few weeks, they moved from standard dashboard layouts to a fully custom data-product environment. The SDK enabled:
In short, Element Logic moved from constrained, generic dashboards to a tailored analytics experience that aligns with both developer expectations and user needs.
Hult Ashridge (formerly “Hult EF”) offers leadership and executive education to large global organizations, and found that its in-house analytics platform was no longer keeping up with their business processes and the needs of their end-users.
Faced with new digital learning products and evolving data sources, the team needed a way to centralize reporting, deliver dashboards within the existing learning platform experience, and update visuals without full engineering involvement.
By embedding Luzmo, they were able to deliver dashboards that match their brand and apply precise permission controls for different corporate clients.
The analytics layer now allows digital teams to drag-and-drop new data sets and visualizations without needing full sprints. Users can drill down through funnel views, and clients see insights on learning hours, engagement, program scores, and NPS all within the same platform, through self service embedded analytics.
As a result, Hult Ashridge deployed six core dashboards with hundreds of users in a matter of months, freed engineers from maintenance of custom reporting, and built a future-proof analytics system without hiring a full data science team.
Zapfloor, a workspace management SaaS that handles desk bookings, digital lobbies, and office-space usage, embedded analytics to provide real-time insights for their customers.
Before embedding dashboards, Zapfloor’s development and analytics teams were overwhelmed by duplicate requests for custom reports. Their existing JavaScript solution supported only three basic dashboards, and each new customer demand meant a new dev cycle.
Once they integrated Luzmo dashboards directly into the application, they rolled out ~30 interactive dashboards that deliver live occupancy data, historical trends, and drill-downs for each office and workstation.
Additionally, the shift increased internal efficiency: the customer success and product teams now build datasets and dashboards independently, with minimal involvement from engineering. One customer success manager said that the workflow is “much more efficient” and feedback loops with customers are shorter.
In short, by embedding analytics, Zapfloor transformed from a platform with static, limited reporting to one offering dynamic, self-service insights. That improved transparency, customer satisfaction, and reduced the backlog of custom analytics requests.
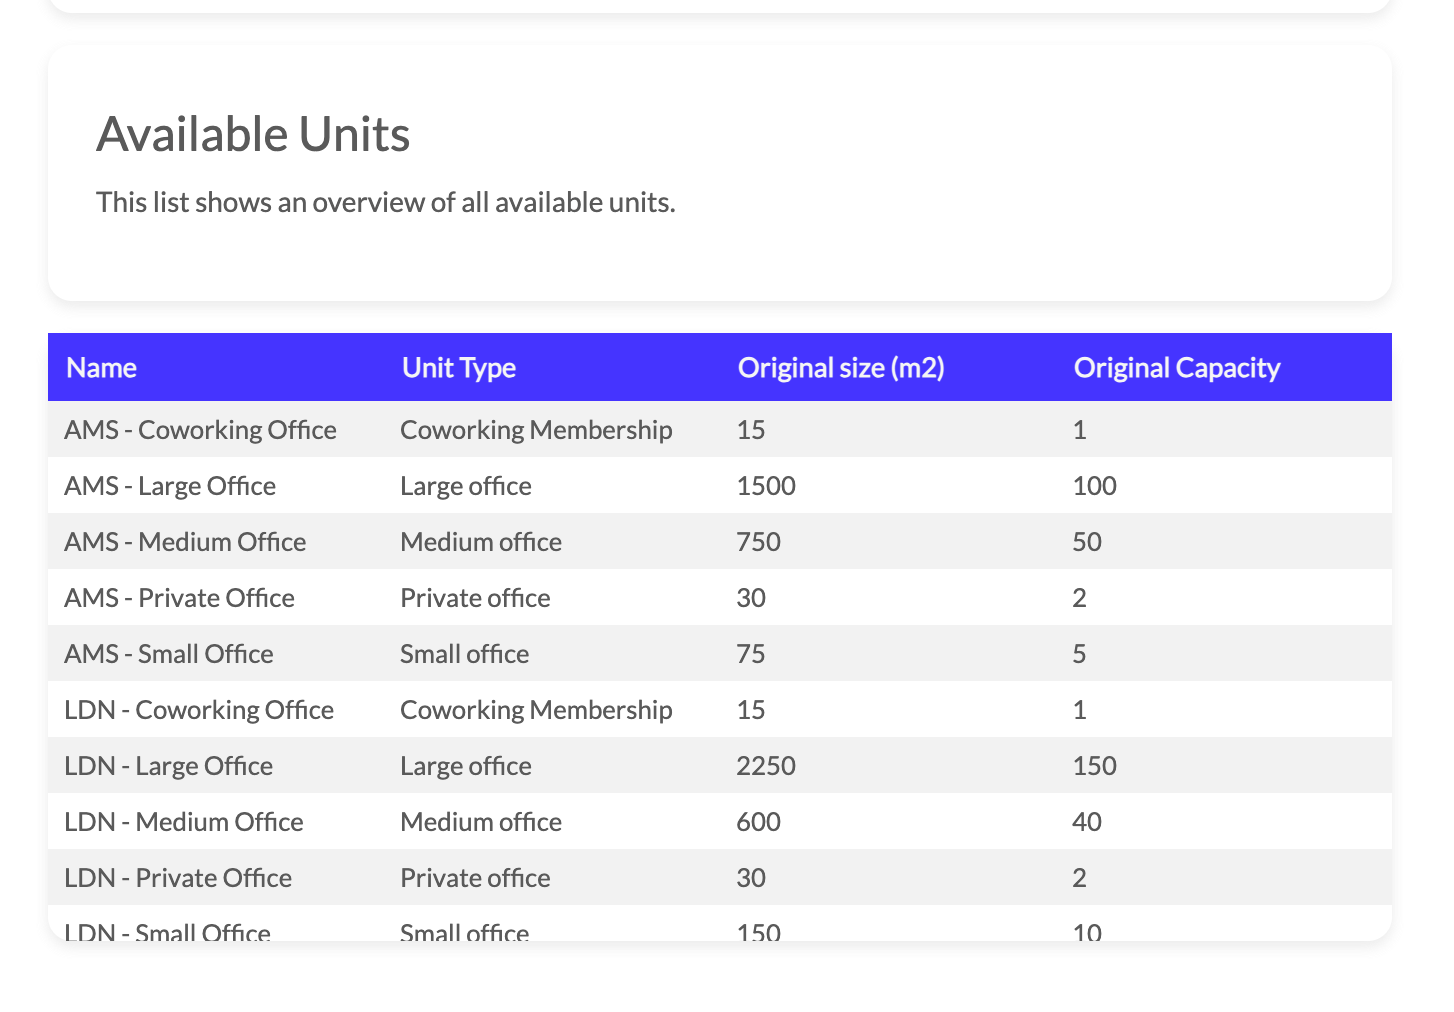
The team at Workero, a platform helping companies rent out unused desks, meeting rooms, and event spaces, embedded an analytics layer to turn their booking data into real-time, user-friendly dashboards.
They tapped into their own API and loaded data on bookings, occupancy, payments, and campaign spend into a new analytics module. One developer said that the open API from Luzmo was a key factor because it allowed fast setup without sacrificing performance or scalability.
Non-technical users now build and manage dashboards independently, covering categories such as overall bookings, useage of space over time, revenue per space, and ad campaign ROI.
When a partner logs in, the dashboard shows only their data thanks to token-based filtering, making the system scalable and secure for many clients.
The result: Workero went to market with a fully operational reporting module nearly at launch, offered a native analytics experience to their partners and freed up their dev team to focus on core features rather than custom reporting.
Deepki is a PropTech platform helping real-estate asset managers transition to net-zero through AI-driven data intelligence.
In the webinar titled “Reducing Carbon Emissions in Real Estate with Embedded Analytics at Deepki”, Deepki shared how they tackled three major challenges: a busy engineering team, diverse stakeholder reporting needs, and a flood of custom requests.
To address this, Deepki embedded Luzmo’s analytics platform directly into their SaaS product. This allowed:
As a result, Deepki offers asset managers interactive dashboards that visualize building performance, carbon emissions, and ESG-compliance metrics, all within their existing workflow. The embedded solution liberated engineering resources, improved stakeholder engagement, and supported a stronger sustainability offering.
The webinar titled “Riskonnect: Empower SaaS Users with Self-Service Reports” explains how the risk-management platform transformed its reporting experience for end users.
Faced with hundreds of bespoke reporting requests each week, Riskonnect needed a solution that could scale without overloading their support or product teams. Engineers were spending too much time on one-off dashboards instead of core features.
By embedding analytics, Riskonnect offered its users template dashboards that they could customize. Clients gained immediate control over their metrics with drag-and-drop views and editing features while the vendor maintained governance via built-in guardrails.
As a result, customer self-service increased, support tickets for analytics dropped, and the product team freed up bandwidth to focus on growth. In short, Riskonnect turned analytics into a differentiator rather than a bottleneck.
The right embedded analytics platform won't take your business from zero to hero but it will do a few things well. Embedded data visualizations help users understand what your platform does, leading to data-driven decision-making. And with data by their side, they will trust your product more, spend more and have a higher lifetime value.
When you seamlessly integrate analytics features in your app, everyone wins. And since you no longer have to compromise with traditional business intelligence tools, proper embedded analytics software can take you there in a fraction of the time and cost.
Try Luzmo today and find out how embedded analytics work for businesses like yours.

All your questions answered.
Build your first embedded data product now. Talk to our product experts for a guided demo or get your hands dirty with a free 10-day trial.


