Embedded Reporting for End Users: What They Need
Embedded reporting is reporting built into a software product, so the product's users can build their own dashboards, then export and schedule reports on their own data without leaving the product or asking its vendor for a custom report.
For product teams, end user reporting means giving customers control over the information they need. Instead of requesting another custom report from support, users can work with their data directly, choose what to display and decide how they want to receive it.
Luzmo, the embedded analytics platform for product teams, helps software companies offer that experience within their existing applications.
How embedded reporting differs from internal reporting
Embedded reporting differs from internal reporting in who it serves: the readers are your customers, each one sees only their own data, and the dashboards carry your brand.
Internal reporting helps your own employees understand the business. Finance might review revenue across departments, while operations monitors performance across locations. Those reports are built for people working inside the same organization.
Embedded reporting serves people using your software. A property management platform, for example, might give each landlord access to reports covering their own buildings. An operations manager working for one customer should never see another customer's information.
That makes tenant access and white-label embedding important product requirements, not optional design details.
In this guide, a dashboard is a live view a user opens, and a report is what a user takes away or receives: an export, a scheduled email or an alert.
Reporting is one part of embedded analytics, which also includes interactive exploration and visualization inside a product.
How embedded reporting works
Embedded reporting works in four layers: the data a report reads from, the tenant access rules that decide who sees what, the report itself, and the way the report reaches the user.
1. The data source
Reporting starts with data the customer is allowed to use. Depending on the software product, that could include transactions, project activity, account performance or other operational records.
The important question is not how many sources the platform supports. It is whether the reporting experience can access the information customers need, in a form they can understand.
2. Tenant access
A multi-customer product must keep each tenant's data separate. Luzmo supports row-level security (RLS) and role-based permissions, so teams can control which records and reporting capabilities users can access.
This cannot depend on somebody remembering to apply the right filter when designing a dashboard. Tenant isolation needs to be enforced consistently across the reporting experience.
For the wider architecture, see how multi-tenancy works in embedded analytics.
3. The report itself
The product presents relevant data through charts, tables and dashboards. Users may start with a dashboard template and, where editing is enabled, change the information displayed to answer their own questions.
Product teams decide how much freedom to offer. Someone who only needs a weekly performance summary may require less flexibility than a customer responsible for analyzing several locations.
4. Report delivery
Dashboards are viewed inside the product. Reports can also be exported, emailed on a schedule or delivered through an alert.
That final layer matters because not every useful insight arrives while someone is looking at a dashboard. Reporting should also support the moments when information needs to reach a user outside the application.
Why product teams add embedded reporting
One reason product teams add embedded reporting is to stop building one-off reports for individual customers.
Castellan, now part of Riskonnect, was receiving hundreds of individual reporting requests every week without enough support or product bandwidth to handle them. As described in Luzmo's March 6, 2024 case study, its solution was to give customers template dashboards they could edit themselves.
The company reported faster customer support and a reduced workload through self-service reporting.
Instead of repeatedly fulfilling the same kinds of reporting requests, its customers could work with the information directly.
What end users need from embedded reporting
End users need five things from embedded reporting: their own data only, a way to build their own dashboards, exports in the formats they use, scheduled or alert-based delivery, and dashboards that look like your product.
The challenge is not simply making these features available. They need to work together without forcing customers to understand the reporting infrastructure behind them.
1. Their own data only
Every customer must see their own data only, so tenant-level access has to be built into the report, not added afterwards.
For a product serving several companies, the reporting layer needs to understand which organization the current user belongs to. Within that organization, different roles may also require different permissions.
A regional manager might need access to several locations, while a local manager should see only one. Row-level security restricts the underlying records, and role-based permissions control what users can do with the reporting experience.
These rules should remain effective whether someone opens a dashboard, adjusts a filter or requests an export.
2. A dashboard they can build themselves
End users stop sending report requests when they can build their own dashboards, within limits you set.
A fixed dashboard may work well for standard questions. It becomes less useful when one customer wants to compare locations, another needs different metrics and a third wants to reorganize the layout.
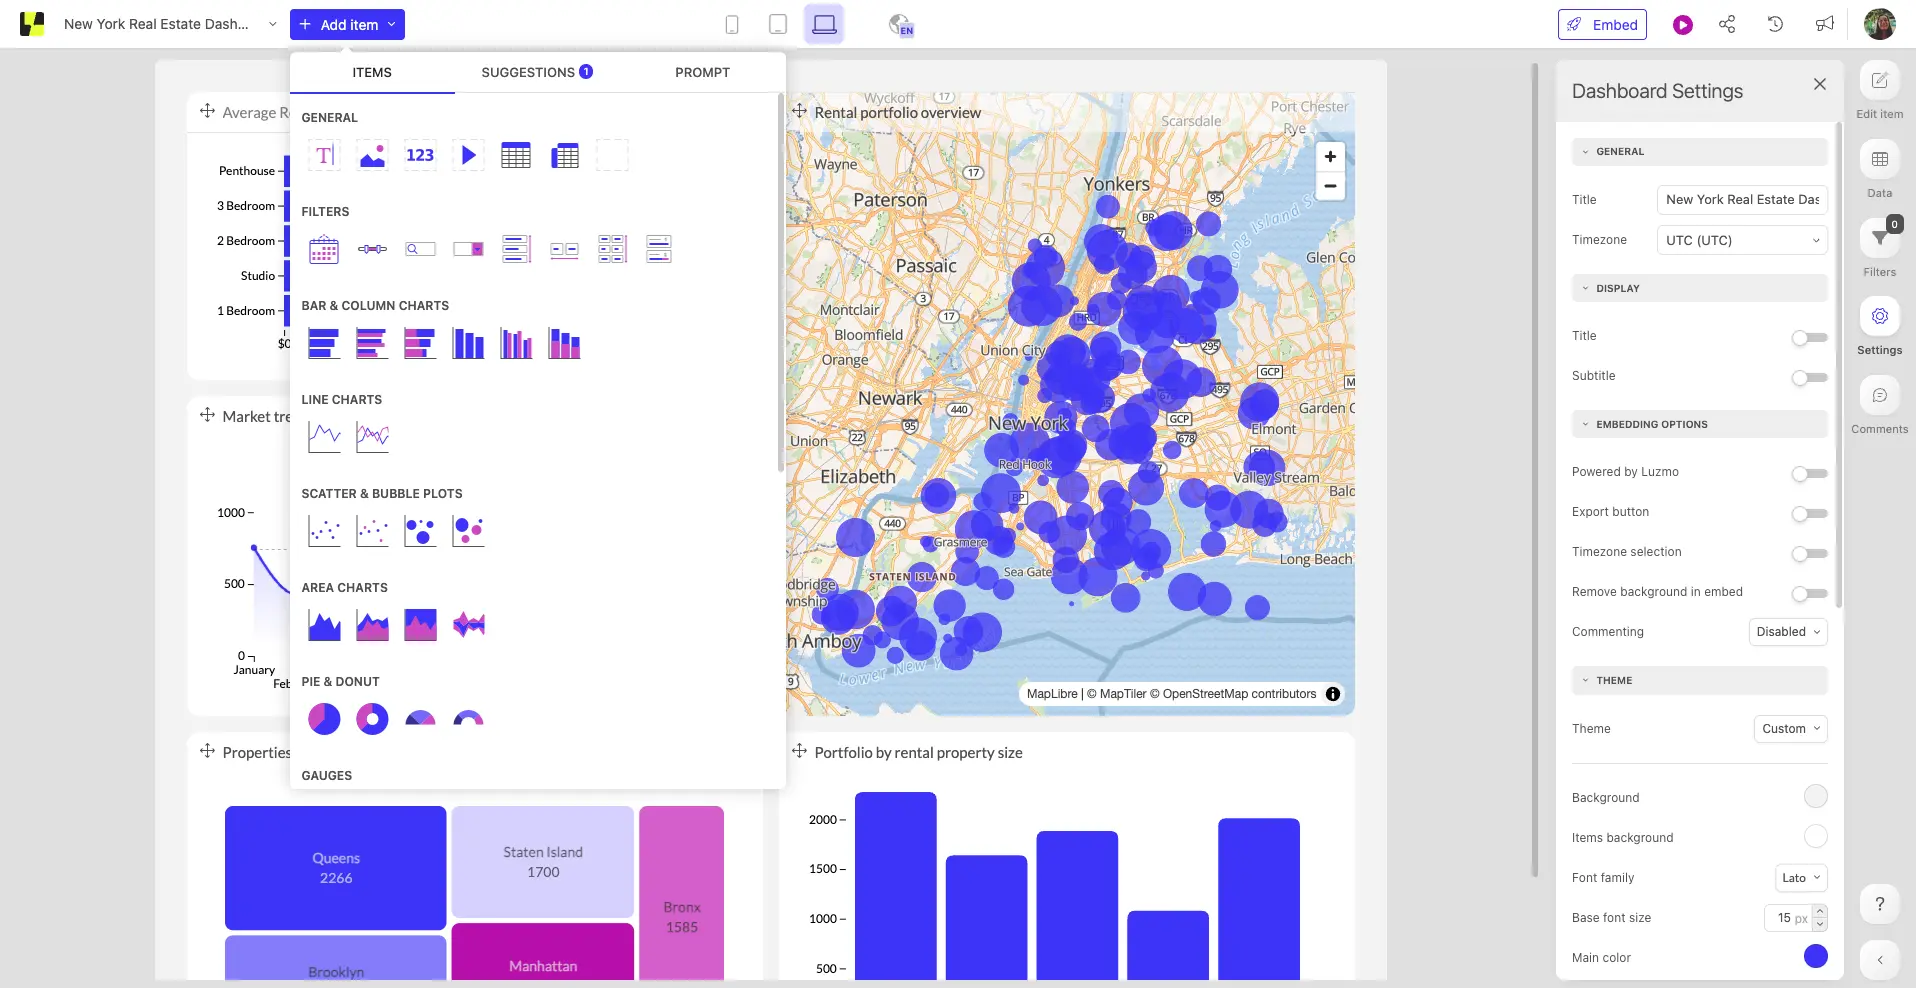
Luzmo's embedded dashboard editor lets customers assemble dashboards through drag and drop, without writing code or needing data-science training.
The product team controls how much editing each customer receives. Less technical users can have limited editing options, while power users can access a fuller dashboard editor.
This gives users flexibility without requiring every customer to start from an empty canvas. A good template can cover the common questions while leaving room for individual needs.
3. Exports in the formats they use
Users take reports out of the product, so exports have to cover the formats they use through the export service: PDF or an image to share, CSV to work in a spreadsheet.
Luzmo's export service supports PNG or PDF exports of dashboards and saved charts, along with CSV exports of charts. These formats serve different jobs. A PDF is useful when someone wants to circulate a report as a document, while CSV gives them data they can work with elsewhere.
There is also a separate developer route. The Luzmo Flex chart-export method can export a chart as CSV, XLSX or PNG, preserving applied filters and styles. This is a chart method developers call, not another set of end-user export buttons.
Product teams should decide which formats to expose based on how customers actually use reports, rather than assuming every user needs every available option.
4. Delivery on a schedule, or when a condition is met
Users should not have to open the product to learn that a condition has been met, so reports need scheduled delivery and alerts.
Luzmo's export service supports scheduled exports sent regularly by email. Dashboard viewers can create exports and scheduled exports, allowing them to receive reporting information without opening the dashboard every time.
Alerts handle a different need. In Luzmo, an alert is triggered when a given query returns a non-empty result. It can send an email or text message, call a webhook or display a Slack message.
A scheduled export delivers reporting information at recurring intervals. An alert communicates that a defined condition has been met. An alert turns reporting into action by bringing a relevant result to someone's attention.
Luzmo also supports data exports delivered by default through an emailed download link, with webhook delivery to the application as an alternative. The download link expires after seven days.
For product teams, these delivery options are worth considering early. A dashboard might answer a question, but a scheduled report or alert helps that information reach the person who needs it.
5. Dashboards that look like your product
Dashboards and embeds should carry your brand, because a view with a vendor's name on it reads as someone else's product.
A customer should not feel as though they have entered an unrelated reporting tool when they open analytics. Layout, typography, colors and interactions should fit the rest of the application.
Luzmo supports white-label embedding through custom themes and CSS injection for advanced styling.
That control applies to the embedded experience, including the look of dashboards. It should not be confused with a claim that generated PDF exports automatically carry customized branding.
Product teams considering more extensive report customization can explore white-label reports separately.
The goal is a reporting experience that customers recognize as part of the product they already use.
Explore how customer-facing reporting can fit into your software product.
How Luzmo handles embedded reporting
In Luzmo, embedded reporting is made of four parts: a dashboard editor that end users build in, then exports, scheduled exports and alerts.
These capabilities serve different moments in the reporting experience. The editor lets users shape the information they see, exports help them share or reuse it, schedules deliver reports regularly, and alerts notify them when a defined query condition is met.
| Part | What it does | Source |
|---|---|---|
| Embedded dashboard editor | Lets users build and customize dashboards with drag and drop, with editing rights controlled by the product team. | Dashboard editor |
| Exports | The export service creates PNG or PDF dashboard and chart exports, plus CSV chart exports. Flex developers can separately export charts as CSV, XLSX or PNG. Data exports can be delivered by email link or webhook. | Export service (opens in new tab), Flex chart export (opens in new tab), Data export (opens in new tab) |
| Scheduled exports | The export service supports recurring report delivery by email, and dashboard viewers can create scheduled exports. | Export service (opens in new tab) |
| Alerts | Triggers when a query returns a non-empty result and can send an email, text message, webhook call or Slack message. | Alert API (opens in new tab) |
Luzmo delivers these capabilities within a multi-tenant embedded analytics platform, with row-level security and role-based permissions to control customer access. White-label embedding lets product teams align the dashboards and their embedded presentation with the application around them.
Reporting is only one part of that setup. For a closer look at configurable in-app reporting, see report builder platforms. For a broader vendor comparison, see embedded analytics tools.
The free trial lasts 10 days.
Mistakes that turn embedded reporting into a download button
Five mistakes turn embedded reporting into little more than a download button.
- Making export the only way out. If customers must download static reports to answer every new question, the product still leaves much of the reporting work to them.
- Giving every user role the same layout. An executive and an operations manager may work with the same data, but they rarely need the same view.
- Adding tenant access after launch. Reporting permissions should be designed alongside the data model, not patched into dashboards once customers start using them.
- Leaving out scheduled delivery and alerts. Users shouldn't have to remember to open a dashboard whenever they need recurring information or an important condition is met.
- Making dashboards look like a third-party tool. Inconsistent branding and interactions make reporting feel disconnected from the rest of the product.
A useful reporting experience should help customers find answers independently while letting the product team retain control over security and the user experience.
Give customers reporting they can use themselves
See how dashboards your customers build, and reports they schedule themselves, look in your own product.
Book a demo to explore the experience with Luzmo.
FAQ
All your questions answered.
What is the difference between embedded reporting and embedded analytics?
Embedded reporting focuses on dashboards and reports users can access, export or receive within a software product. Embedded analytics is the broader category, which can also include interactive data exploration and visualization. Reporting is one way to deliver embedded analytics to customers.
Can dashboard viewers schedule emailed exports in Luzmo?
Yes. Luzmo's export service allows dashboard viewers to create exports and scheduled exports. A schedule sends reports regularly by email, so viewers can receive reporting information without returning to the dashboard each time. The documentation does not specify a fixed set of scheduling frequencies.
Which export formats does Luzmo support?
Through its export service, Luzmo supports PNG and PDF exports for dashboards or saved charts, and CSV exports for charts. The separate Luzmo Flex chart-export method allows developers to export a chart as CSV, XLSX or PNG, preserving applied filters and styles.
Can end users build their own dashboards in Luzmo?
Yes. Luzmo's embedded dashboard editor lets users create and customize dashboards through drag and drop without coding. Product teams can control editing rights for different customers, from limited editing options to a fuller editor for power users who need more flexibility.
Does Luzmo support alerts?
Yes. Luzmo supports alerts triggered when a given query returns a non-empty result. An alert can send an email or text message, call a webhook or show a Slack message. This lets teams deliver notifications based on defined query conditions.
Written by

Ship the future of your data
Let us show you what Luzmo can do for your product.

Book your session with our analytics expert.