How 5 SaaS Companies Scaled Customer-Facing Analytics

A few dashboards are manageable. The difficulty starts when every customer wants different metrics, filters or reporting views.
At that point, customer-facing analytics can become a second product hiding inside the first. Engineers maintain visualizations, product teams prioritize reporting requests and customer success collects another round of exceptions.
The challenge is not simply adding more charts. It is finding a delivery model that works across customers without rebuilding the reporting layer each time.
zapfloor, Intent Technologies, Selligent, Commspace and Leasetrack took different routes. Their examples show how SaaS teams can scale analytics through reusable dashboards, self-service tools, multi-tenant delivery and more manageable product workflows.
Five ways SaaS companies scaled customer-facing analytics
| Company | Scaling challenge | Operating model |
|---|---|---|
| zapfloor | A growing backlog of customer dashboard requests | Product and customer success create dashboards with limited developer involvement |
| Intent Technologies | Highly specific dashboards took weeks to produce | Standard reporting plus flexible custom analytics |
| Selligent | Customers needed both standard and customizable reports | A phased reporting model with a white-label dashboard editor |
| Commspace | Dashboards needed to be assigned and managed across clients | A custom admin portal built around embedded dashboards |
| Leasetrack | Analytics had to serve a growing user base without becoming difficult to maintain | A scalable embedded BI layer selected after evaluating more than 20 platforms |
zapfloor let customer-facing teams handle more dashboard work
zapfloor provides workspace management software for desk booking, visitor management and office utilization. Its customers rely on reporting to understand how people use their spaces.
For two years, the platform offered three basic dashboards through a JavaScript package. As customer expectations grew, those reports became too limited. The team faced more requests while working with constrained engineering capacity.
Instead of routing every change through developers, zapfloor created a workflow in which the product and customer success teams could build new datasets and dashboards more independently. Development still handled deployment through one quick touchpoint, but it no longer owned the entire dashboard creation process.
That shift matters when analytics requests come from multiple customers. A scalable model does not remove engineering completely. It reduces the number of steps that require engineering attention.
zapfloor expanded from a small set of standard reports to a broader analytics experience with real-time insights. At the same time, internal teams gained a shorter path from customer request to a live dashboard.

Read the full zapfloor case study →
Intent Technologies reduced custom dashboard delivery from weeks to days
Intent Technologies helps property managers and public organizations oversee services across buildings and cities. Its platform combines data from multiple providers, then presents alerts and operational information to customers.
The company already had standard reporting built with custom code. The model worked for common KPIs, but it became difficult to scale as customers requested dashboards tailored to their own use cases.
Custom development made each new dashboard expensive. Intent needed to preserve its operational analytics while shortening the path for customer-specific reporting.
The resulting setup combined three layers:
- operational analytics,
- standard reports shared across customers,
- flexible custom dashboards for individual use cases.
This hybrid model avoided an all-or-nothing decision. Intent did not replace every part of its analytics stack. It used embedded analytics where flexibility and speed mattered most.
The company reported reducing dashboard production from weeks to days, and in some cases hours. It also completed a production integration in less than two months through a guided validation program.

Read the full Intent Technologies case study →
Selligent created separate reporting experiences for different customer needs
Selligent, now part of Marigold, needed to make campaign analytics more useful inside its marketing platform.
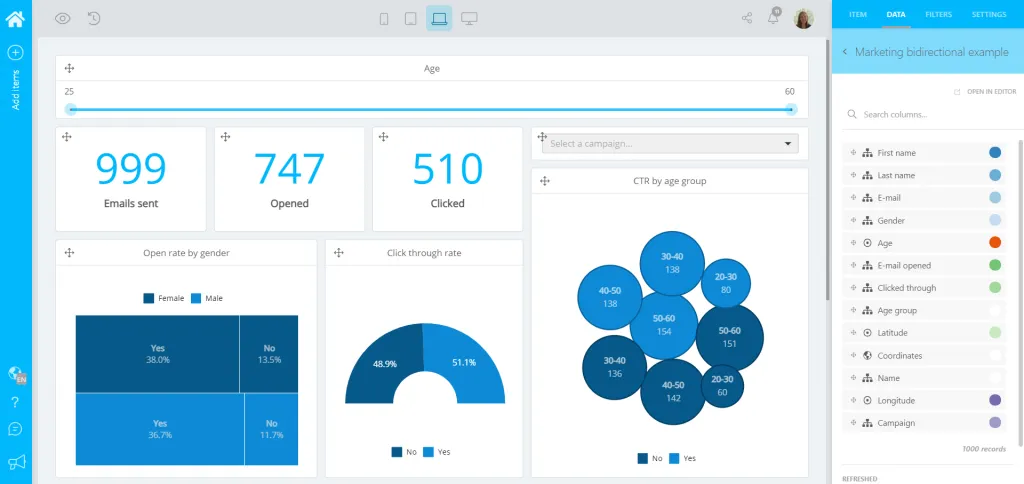
A single reporting experience would not serve every customer. Some users needed ready-made dashboards with common campaign metrics. Others wanted more control over how they explored and presented their data.
Selligent introduced customer-facing analytics in three phases:
- General reporting dashboards for all customers.
- A white-label dashboard editor for premium pricing tiers.
- Deeper connections between insights and marketing actions.
This structure gave the company a way to scale without treating every customer request as a custom project. Standard dashboards served common needs, while the editor gave selected customers room to create their own reporting views.
The model also turned analytics into part of the product packaging. The white-label editor became a paid add-on for premium customers, so more advanced self-service capabilities could support higher tiers instead of remaining an unlimited service delivered manually by the product team.
Read the full Selligent case study →
Commspace built an admin layer for managing embedded dashboards
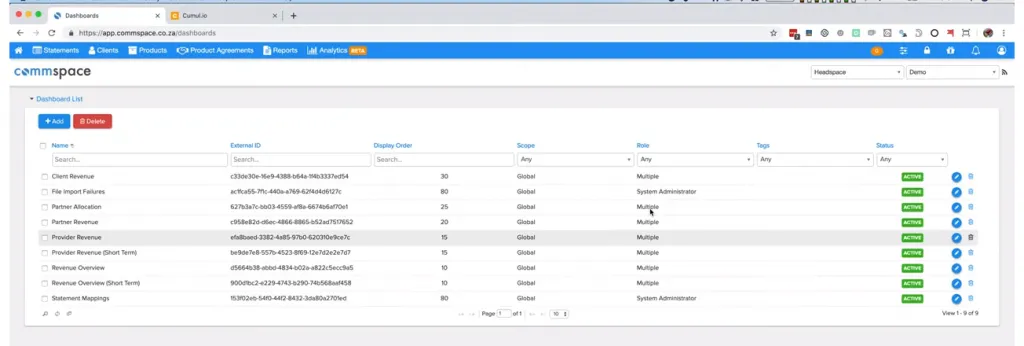
Commspace took a different route. The company used Luzmo as its embedded dashboard layer, then built an internal management interface around it.
The admin portal allowed the team to:
- add or remove dashboards,
- control which customers could access each dashboard,
- organize report order,
- apply client, office, role or tag-based access,
- open reports with predefined filters.
This meant the team could manage customer-facing dashboards without changing application code for every routine update.
Commspace also separated dashboard editing from production. Draft changes could be prepared away from the customer-facing environment, then published when ready.
That operating model is useful for SaaS platforms with several dashboards and customer segments. Scaling analytics is not only about rendering more charts. Teams also need a manageable way to govern which reports are live, who can see them and how updates move into production.
Read the full Commspace case study →
Leasetrack selected a reporting layer designed to scale with the product
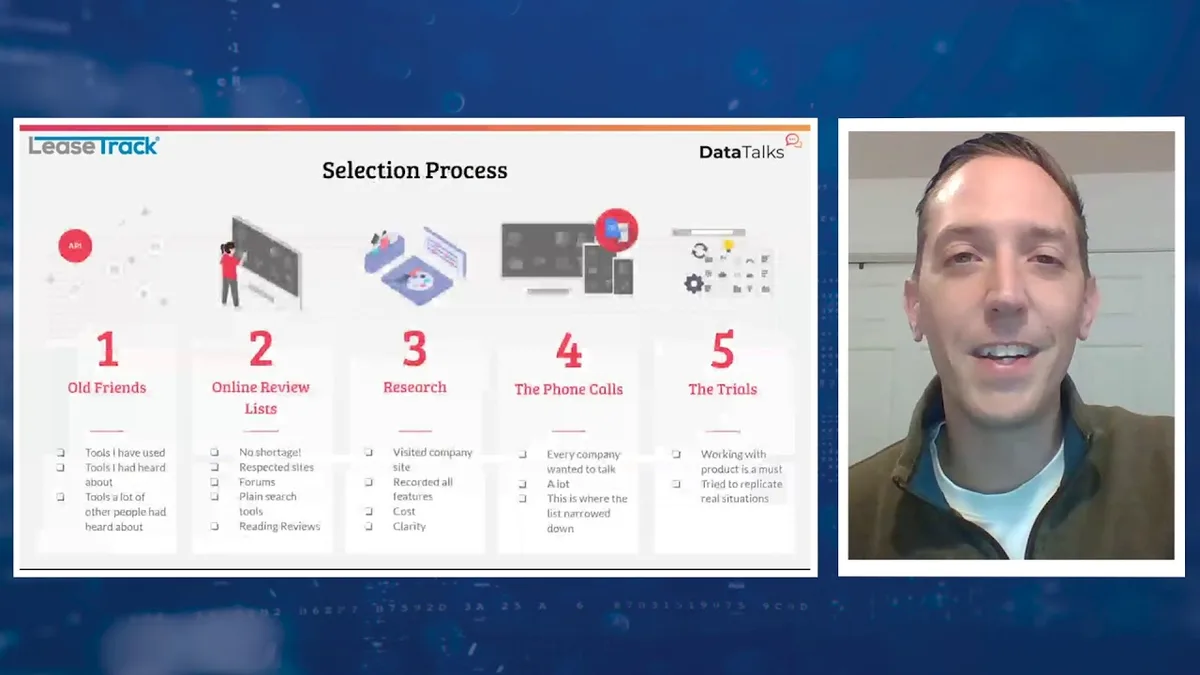
Leasetrack approached the problem from the vendor-selection stage.
The company needed analytics that could sit inside its own interface, connect directly to PostgreSQL and serve a growing number of users. The reporting layer also had to look modern and remain straightforward to implement.
Its business intelligence analyst evaluated between 20 and 30 BI platforms. The process narrowed the market through research, demos and trials based on real product scenarios.
Leasetrack selected Luzmo around three practical priorities:
- fit with the embedded use case,
- time saved through easier implementation,
- support during onboarding and long-term use.
During the free trial, the team could create and embed a dashboard on the first day. That early test helped Leasetrack judge the workflow it would use repeatedly after purchase, not only the quality of a polished demo.
The lesson is easy to miss: analytics scalability begins before implementation. Selecting a platform around real data, permissions, embedding and maintenance requirements reduces the risk of choosing a tool that works for one dashboard but not for the product around it.
Read the full Leasetrack case study →
Scaling analytics requires more than a scalable chart library
The five companies solved different parts of the same operating problem.
zapfloor changed who could create dashboards. Intent split standard and custom reporting into separate layers. Selligent matched analytics capabilities to different customer needs. Commspace created a management interface for ongoing governance. Leasetrack evaluated tools around the workflows it expected to repeat.
Together, the examples point to five parts of a scalable customer-facing analytics model:
- Reusable reporting — dashboards and data models that solve common needs across customers.
- Customer-specific flexibility — templates or self-service editing for tailored views.
- Access and permissions — secure, multi-tenant control over who sees what.
- Manageable publishing workflow — a clear path from draft to production.
- Limited engineering dependency — routine changes that do not reopen the full development process.
A platform can technically support thousands of viewers and still create an operational bottleneck. The stronger test is whether the people closest to customer needs can update analytics without reopening the full engineering process.
Before customer-facing analytics expands, product teams should answer five questions:
- Who owns routine dashboard creation?
- Which reports should be reusable across customers?
- Where does customization create commercial value?
- How will dashboards be assigned, updated and governed?
- Can the reporting layer grow without rebuilding the integration?
A practical model for SaaS teams
Customer-facing analytics usually becomes easier to scale when the product supports three layers.
A reusable foundation
Start with dashboards, metrics and data models that solve common customer needs. This limits duplicated work and creates a stable reporting baseline.
Controlled flexibility
Give internal teams or selected customers ways to adapt analytics without exposing the full complexity of the underlying data. That may mean dashboard templates, a white-label editor or a process for creating custom views.
A clear publishing and governance workflow
Decide how a dashboard moves from draft to production, who can assign it to customers and how access is controlled. These workflows become more important as the number of dashboards grows.
The right balance depends on the product. A smaller SaaS company may need internal self-service for product and customer success. A mature platform may package dashboard creation as a premium customer feature. Another may keep standard analytics in custom code and use embedded analytics components only for tailored reporting.
The goal is not to force every company into the same architecture. It is to stop every analytics request from becoming a new software project.
What product teams can learn from these examples
If you are weighing your own approach, it helps to see more embedded analytics examples and to work through a structured build vs buy comparison before committing to a direction.
For many SaaS teams, the real choice is not between paying for software and building a few charts. It is between using a maintained embedded analytics layer and becoming responsible for an expanding BI product inside the existing product.
zapfloor, Intent Technologies, Selligent, Commspace and Leasetrack each kept their teams focused on the product value only they could build.
FAQ
All your questions answered.
What makes customer-facing analytics scalable?
Scalable customer-facing analytics combines reusable dashboards, secure multi-tenant access and a manageable update workflow. Teams should be able to support new customers and reporting needs without rebuilding the analytics layer or involving developers in every routine change.
Should every customer receive the same dashboards?
Not necessarily. Standard dashboards can cover common needs, while templates, configurable views or self-service editing can support more advanced customers. The important part is controlling customization so it does not create separate code and maintenance work for every account.
How can SaaS companies reduce their analytics development backlog?
They can separate initial integration work from ongoing dashboard management. Product, data or customer success teams may then handle routine dashboard creation while engineering focuses on authentication, data access and deeper product integrations.
What should teams test before choosing an embedded analytics platform?
Teams should test the platform with their own data and realistic product scenarios. Important checks include embedding, permissions, multi-tenant delivery, dashboard creation, customization, performance and the workflow required to publish future changes.
Written by

Ship the future of your data
Let us show you what Luzmo can do for your product.

Book your session with our analytics expert.