How 5 Companies Reduced Reporting Work Across Their Teams

Reporting requests rarely arrive as one big project. They show up as a steady stream of small asks: a filtered export here, a custom view there, a recurring summary for one customer that nobody else needs.
Individually, each request looks minor. Together, they consume support time, pull product and data teams away from the roadmap and leave a backlog that never quite clears.
Riskonnect, Spaceflow, Field & Concept, Lansweeper and zapfloor each reduced that load in a different way. None of them did it by cutting people. They did it by making the common questions answerable inside the product, so human effort could move to the work that genuinely needed it.
Five ways to reduce reporting work
| Company | Where the load came from | What reduced it |
|---|---|---|
| Riskonnect | Hundreds of individual reporting requests | Editable template dashboards with guardrails |
| Spaceflow | Repetitive requests for the same views | A broader reporting overhaul and an integrated portal |
| Field & Concept | Manual preparation before business reviews | A shared customer zone with current data and dashboards |
| Lansweeper | Support calls to interpret technical data | Interactive exploration inside the product |
| zapfloor | Customer ideas stalled by development backlog | Self-service dashboards customers could adjust themselves |
Riskonnect cut repetitive requests with editable templates
Riskonnect manages complex risk, compliance and business continuity data. Its customers often need reports shaped around their own organization, roles and risk model.
The product team was receiving hundreds of individual reporting requests each week. Many made sense for one customer but had little value for the wider user base.
Building each report centrally could not scale. Giving every user unrestricted access to the underlying data model would create a different set of problems.
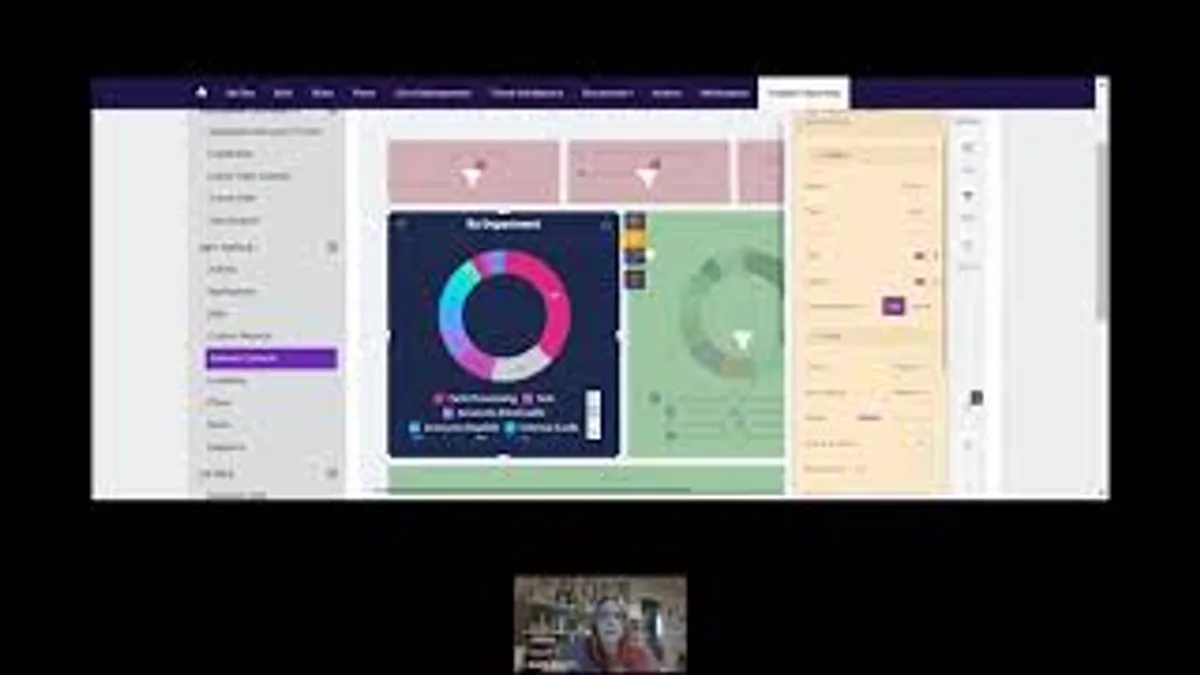
Riskonnect introduced template dashboards that customers could edit to suit their needs. The templates provide a useful starting point, while guardrails limit what users can change.
That balance matters. A blank canvas can overwhelm non-technical users, while a fixed report cannot cover every situation. Editable templates let customers answer more of their own questions without waiting for another one-off build.
Read the Riskonnect customer story →
Spaceflow reduced generic requests with a broader reporting overhaul
Spaceflow provides a tenant-experience platform for landlords and property managers. Its customers wanted a clear view of how buildings and communities were performing.
Earlier reporting relied on stand-alone dashboards that sat outside the main product experience. Customers still asked the Spaceflow team for the same views again and again.
Spaceflow moved reporting into an integrated portal experience and reworked how customers accessed data. According to the case study, generic reporting requests dropped by up to 80% after this broader overhaul.
That number is worth reading carefully. It followed a wider set of changes, not embedding alone. The lesson is not a guaranteed percentage; it is that putting the right reporting in front of customers removes many of the repetitive asks a team would otherwise field by hand.
Read the Spaceflow case study →
Field & Concept cut preparation time before business reviews
Field & Concept runs field marketing and retail activation campaigns for its clients. Each client relationship involves regular business reviews built on campaign performance and budget data.
Preparing those reviews used to mean pulling data together manually before every meeting. The work was repetitive and slowed the team down.
Field & Concept centralized raw data and dashboards in a shared customer zone. Clients can see current campaign performance and budget pacing whenever they want, rather than waiting for a prepared deck.
According to the case study, business reviews required much less preparation as a result. The conversations shifted from assembling numbers to discussing what the numbers meant.

Read the Field & Concept case study →
Lansweeper let users explore data without calling support
Lansweeper manages large volumes of technology asset data. Its users often need to investigate specific devices, risks or troubleshooting questions.
The earlier analytics experience made exploration slower and less intuitive. Users could access data, but moving from a question to an answer often meant contacting support.
Lansweeper embedded a more interactive dashboard experience so users could explore data on their own. According to the case study, users could investigate questions without relying on the support team.
The company also described placing contextual analytics inside asset and troubleshooting workflows, with that experience noted as being in beta and conversational exploration through Luzmo IQ described as a next phase. Those capabilities should be read as evolving rather than finished.

Read the Lansweeper case study →
zapfloor unblocked customer ideas stuck behind the backlog
zapfloor provides workspace and flex-office management software. Its customers regularly suggested new reporting ideas they wanted to see in the product.
Many of those ideas stalled. Development capacity was not always available to build each requested view, so good suggestions sat in a queue.
zapfloor gave customers workspace analytics dashboards they could adjust themselves. Instead of every idea becoming a development ticket, customers could shape more of their own reporting.
That change reduced the number of requests that depended on engineering time. The team could focus development capacity on the work that genuinely required it, rather than on individual reporting tweaks.

Read the zapfloor case study →
The common thread: route each request to the cheapest good answer
None of these companies removed reporting work by removing people.
They reduced it by making common questions answerable without manual effort. Riskonnect uses editable templates. Spaceflow reworked how customers reach reporting. Field & Concept centralized data in a customer zone. Lansweeper embedded exploration in the workflow. zapfloor gave customers control over their own dashboards.
The pattern underneath is a routing decision. When a customer needs an answer, the question is which option resolves it at the lowest cost while still being useful.
Four steps to reduce reporting requests without cutting corners
Make existing reports easy to find
Many requests are for information that already exists. Discoverability, search and sensible defaults remove a surprising share of the backlog before anything is built.
Offer reusable dashboards for common questions
A well-designed dashboard answers the same recurring question for many customers at once, instead of one export at a time.
Provide self-service for the long tail
Editable templates, filters and customization let customers handle variations that would never justify a central build.
Reserve custom work for genuinely new needs
Some questions are new, complex or strategic. Those deserve product or data time, which is easier to protect once the repetitive requests are handled elsewhere.
Where reducing reporting work fits with your other decisions
Cutting reporting requests works best alongside the wider way customers experience data. It builds on giving users more control over their own reporting and on moving beyond static exports and separate tools.
If you are trying to protect development time, it also helps to see how teams saved development time with embedded analytics and how they scaled customer-facing analytics as demand grew. You can explore embedded analytics as a product capability rather than a one-off feature.
Riskonnect, Spaceflow, Field & Concept, Lansweeper and zapfloor each reduced manual reporting work by matching the answer to the question, instead of treating every request as another build.
FAQ
All your questions answered.
How can embedded analytics reduce reporting requests?
When customers can find, filter and explore reports inside the product, they answer more of their own questions instead of asking support, customer success or the product team to build another one-off report. The goal is fewer repetitive requests, not the removal of every human interaction.
Does self-service reporting eliminate custom work?
No. Self-service handles common and repeatable questions. Genuinely new or complex requests still need product or data work. A good setup routes each request to the cheapest option that answers it well, from a reusable dashboard to a custom build.
Is reducing reporting requests the same as cutting headcount?
No. These stories describe less manual reporting work and shorter preparation time, not staff reductions or universal cost savings. Teams often redirect the freed-up time toward higher-value work rather than removing roles.
How much can reporting requests actually drop?
It varies by company and depends on more than embedding. Spaceflow reported up to 80% fewer generic requests after a broader reporting overhaul, so results should be read in the context of each company's wider changes rather than as a guaranteed number.
Written by

Ship the future of your data
Let us show you what Luzmo can do for your product.

Book your session with our analytics expert.