How 5 SaaS Companies Give Users More Control Over Their Data
A standard dashboard can answer common questions. It cannot anticipate every question every customer will ask.
That is where self-service analytics becomes useful. Instead of sending another reporting request to support, users can adjust a dashboard, explore a dataset or ask a new question inside the product.
The level of control varies widely. Some SaaS companies let customers edit approved templates. Others provide a white-label dashboard builder. A few are moving toward conversational data exploration.
Riskonnect, Selligent, Kenjo, Katana and Lansweeper show five different models. Together, their stories make one point clear: self-service works best when freedom is matched with sensible guardrails.
Five self-service analytics models
| Company | Self-service model | User control |
|---|---|---|
| Riskonnect | Editable template dashboards | Users adapt approved reports within defined guardrails |
| Selligent | White-label dashboard editor | Premium customers create dashboards from scratch |
| Kenjo | Dashboard variants | Users customize standard templates and share approved versions |
| Katana | AI-assisted data exploration | Users ask questions and receive relevant visual answers |
| Lansweeper | Interactive exploration and AI-assisted querying | Users explore data without relying on support or SQL |
Riskonnect gives users editable templates instead of unlimited freedom
Riskonnect manages complex risk, compliance and business continuity data. Its customers often need reports tailored to their own organization, roles and risk model.
The product team was receiving hundreds of individual reporting requests each week. Many requests made sense for one customer but had little value for the wider user base.
Building each report centrally would not scale. Giving every user unrestricted access to the underlying data model would create a different set of problems.
Riskonnect introduced template dashboards that customers could edit to suit their needs. The templates provide a useful starting point while guardrails limit what users can change.
That balance is important for non-technical audiences. A blank canvas can feel flexible to an experienced analyst and overwhelming to everyone else. Templates shorten the path to a useful report while still giving customers room to personalize it.
The model also reduces support workload. Customers can answer more of their own questions without waiting for the product or services team to create another one-off report.
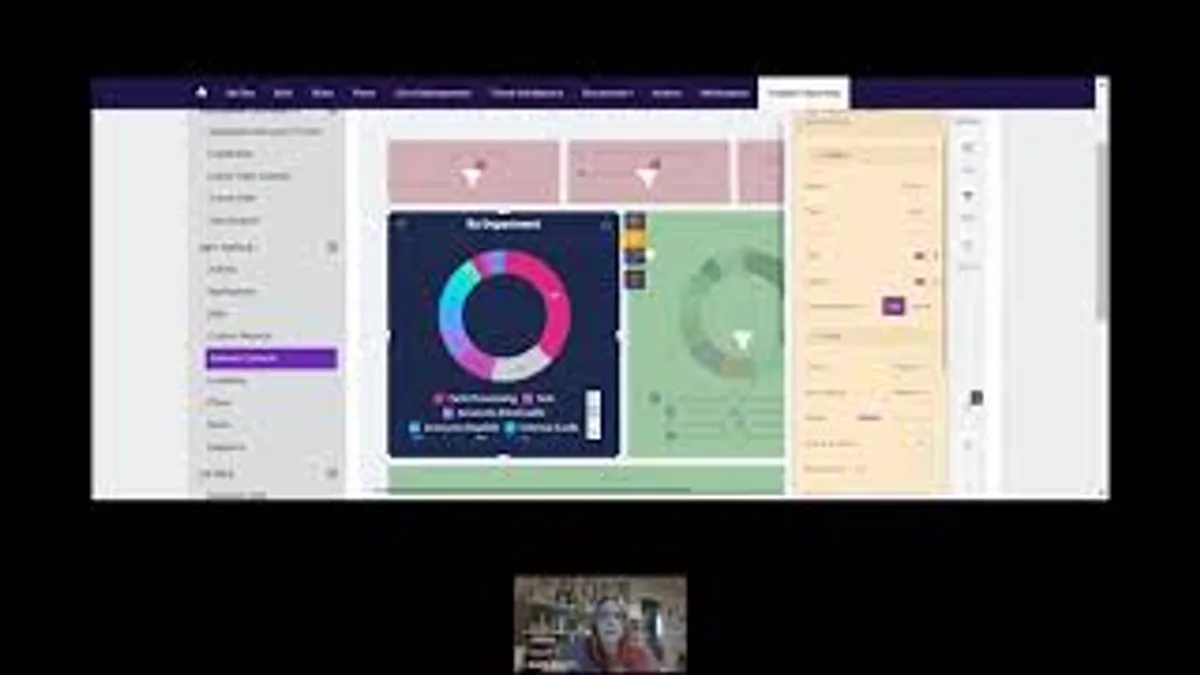
Read the Riskonnect customer story →
Selligent lets premium customers build dashboards from scratch
Selligent Marketing Cloud serves marketers across industries with very different campaign strategies and reporting needs.
General campaign dashboards could support common metrics, but they could not cover every vertical, business model or tactical change. Customers wanted to explore data from their own point of view.
Selligent created a double reporting layer:
- standard dashboards for all customers,
- a white-label dashboard editor for premium tiers.
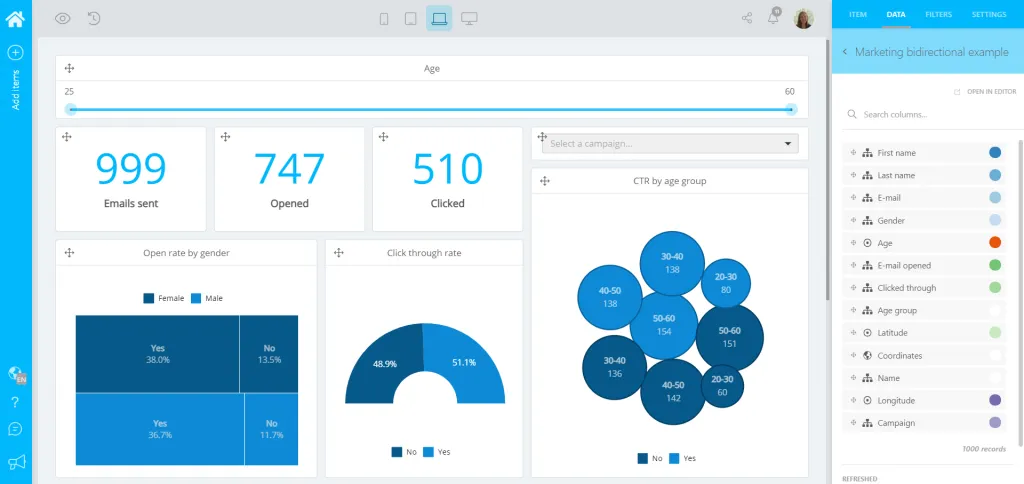
The editor allows marketers to build their own dashboards without leaving the Selligent product. Before releasing it, Selligent refined its data model so non-technical users could work with it more confidently.
This is a deeper form of self-service than editing a template. Users can create their own reporting views, while Selligent controls the datasets and product experience around them.
The capability also became part of Selligent's packaging. Advanced reporting could be offered as a paid add-on instead of remaining an unlimited internal service.
Read the Selligent case study →
Kenjo started with standard dashboards, then tested user-created variants
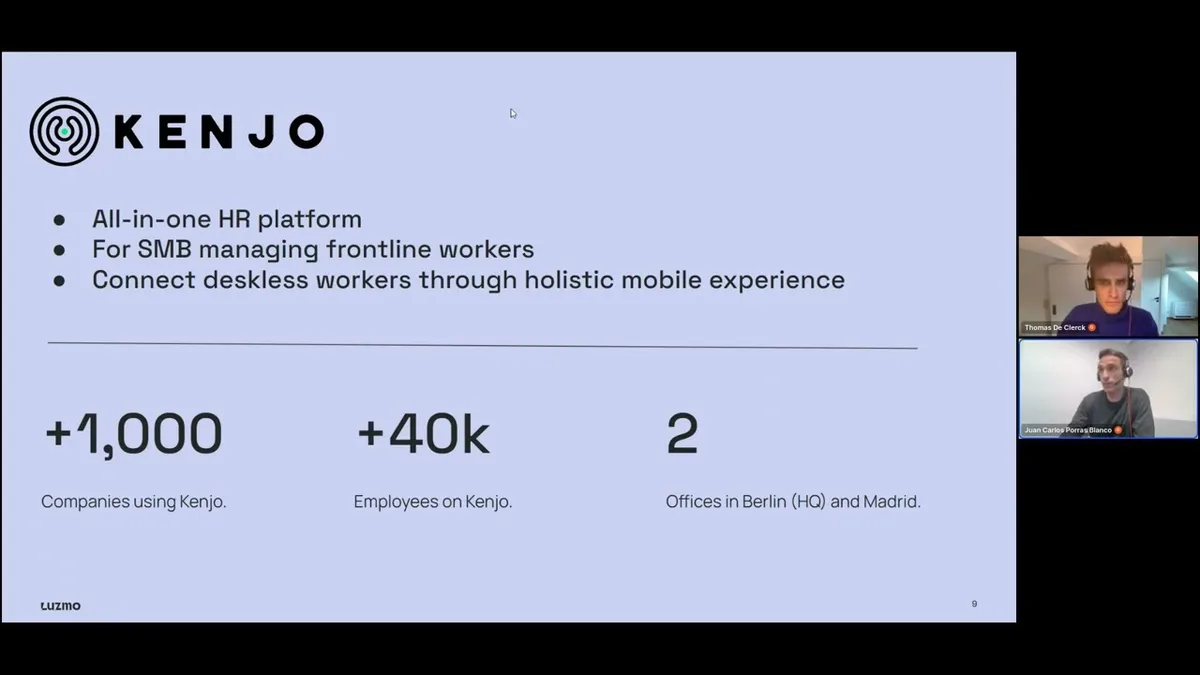
Kenjo gives HR teams a central place to manage employee data and workforce processes. Its customers wanted insights without exporting and manipulating data in spreadsheets.
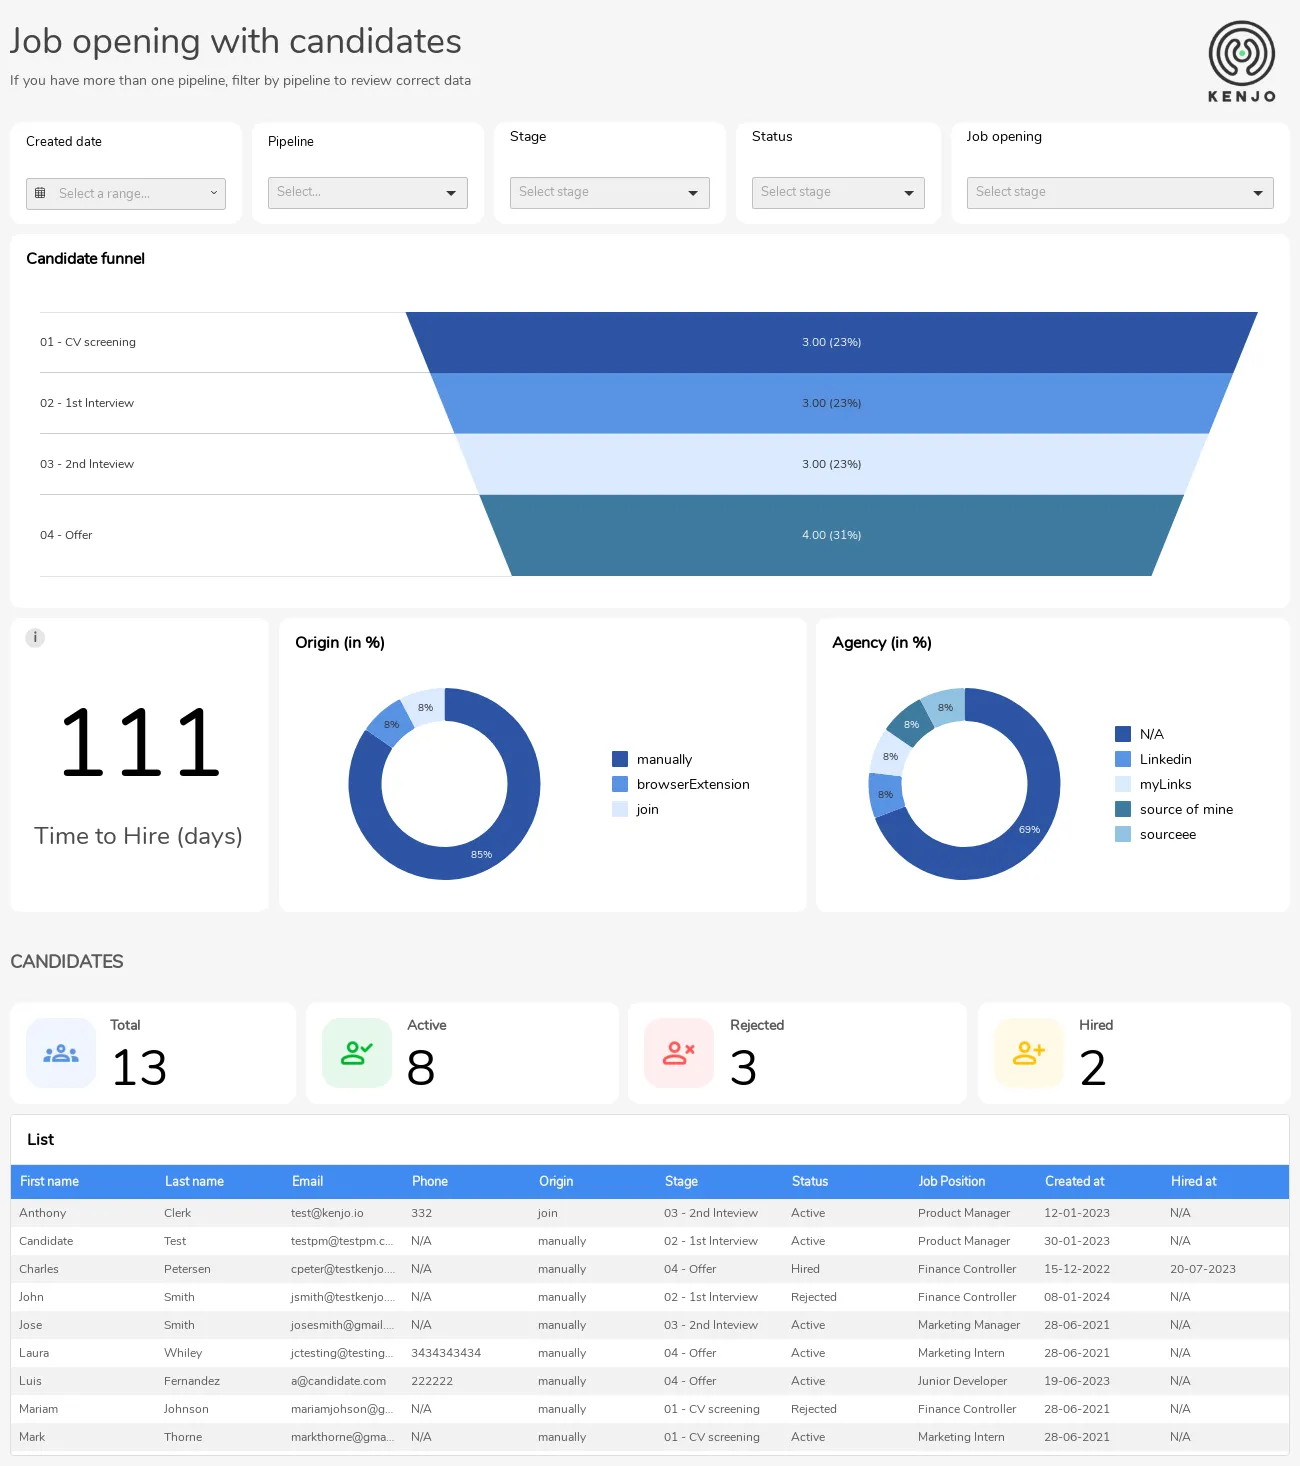
The company launched more than 30 embedded dashboards, with approximately 90% of customers using at least one dashboard each week at the time of the case study.
High adoption did not remove the need for flexibility. Customers still wanted control over which information appeared and who could view it.
Kenjo tested dashboard variants: customers would begin with a standard template, customize it and publish the new version to people inside their organization.
This creates a middle ground between fixed dashboards and a completely blank editor. Kenjo can maintain a recommended structure while customers adapt it to their own policies and reporting needs.
The case study describes a successful proof of concept and a planned rollout, so the customizable variants should be read as an evolving capability rather than a finished, generally available feature.
Katana is moving from static reporting toward AI-assisted exploration
Katana Cloud Inventory serves growing manufacturers and other small businesses that need fast operational visibility.
As its user base expanded, customers wanted quicker and more flexible access to data. Static dashboards were useful, but users also needed answers to questions that had not been anticipated in advance.
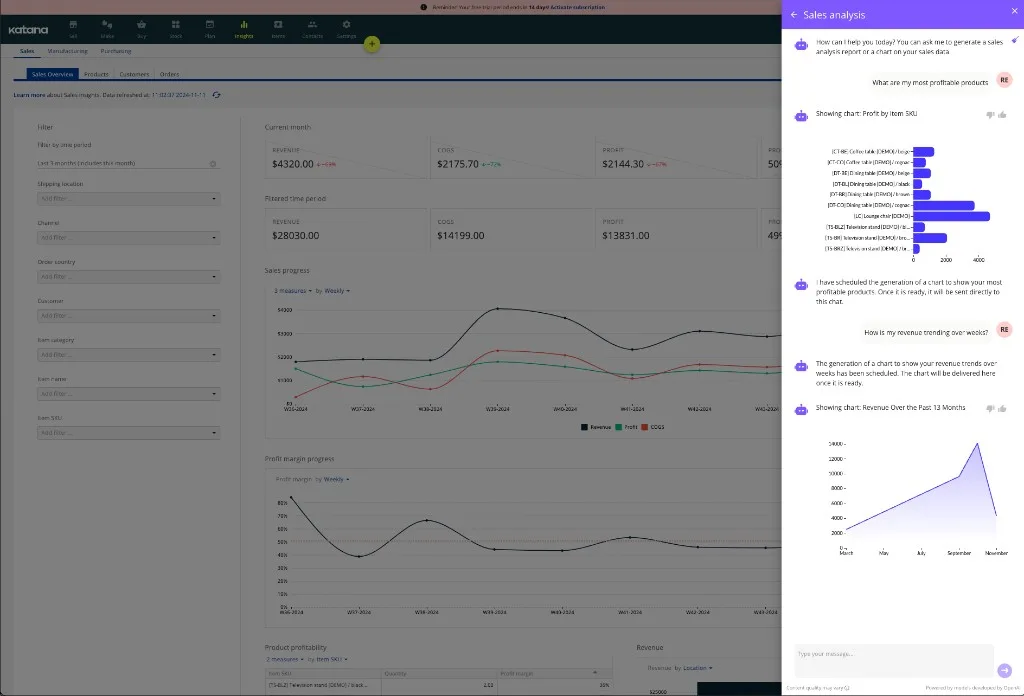
Katana collaborated with Luzmo on an AI-assisted exploration model. A user asks a question, Katana's AI agent passes the request to Luzmo and the system translates it into relevant queries and visual answers.
The planned workflow accounts for access rights and localization. This matters because conversational analytics cannot bypass the permissions already present in the product.
Katana's story represents a newer form of self-service. The user does not need to understand the data model or build a chart manually. They express the question in familiar language and receive a visual response.
The source story focuses on the collaboration and intended experience, so it describes a direction rather than a fully measured, mature deployment.
Lansweeper helps users explore technical data without calling support
Lansweeper manages large volumes of technology asset data. Its users often need to investigate specific devices, risks or troubleshooting questions.
The company's previous analytics experience made exploration slower and less intuitive. Users could access data, but they did not always have an easy way to move from a question to an answer.
Lansweeper embedded a more interactive dashboard experience that allowed users to explore data without contacting support. It also began placing insights directly inside asset pages and troubleshooting workflows.
The next step described in the case study is conversational exploration through Luzmo IQ. Instead of learning SQL or navigating a complex reporting setup, a user could ask a question and receive an answer grounded in the data they are allowed to see.
Lansweeper's example shows that self-service does not need to live in one reporting section. Exploration can be embedded at the point where the user encounters a problem.

Read the Lansweeper case study →
Self-service is a spectrum, not a checkbox
These five examples give users different levels of control.
Riskonnect starts from approved templates. Selligent offers a full dashboard editor. Kenjo explores customizable variants. Katana uses AI to turn questions into visual answers. Lansweeper places exploration inside existing product workflows.
Taken in order, they trace a spectrum: from a fixed dashboard, to interactive filters, to editable templates, to dashboard variants, to a full dashboard builder, and finally to conversational exploration. Each step adds flexibility, and each step also requires stronger onboarding, permissions and guardrails.
The right model depends on the audience.
A trained analyst may value a blank canvas. A busy HR manager may prefer a trusted template. A technical user troubleshooting an asset may want a chart in context. A less technical executive may prefer to ask a question in plain language.
The design choice is not simply how much freedom to provide. It is how much freedom users can use successfully.
Four guardrails every self-service experience needs
A curated data model
Users should see business-friendly metrics and fields, not the full complexity of internal databases.
Permissions inherited from the product
Self-service cannot weaken tenant isolation or expose data users were not already allowed to access.
A useful starting point
Templates, suggested questions and recommended views help users reach value faster than an empty screen.
Support for different skill levels
Some customers will customize everything. Others will never touch an editor. A good product keeps standard reporting useful while offering deeper control to the users who need it.
Where self-service fits alongside other reporting decisions
Giving users control is one part of a larger question about how customers experience data. It works best when the product already helps customers see the value they are getting and when reporting has moved beyond static exports and separate tools.
If you are deciding how much control to offer, it helps to review embedded analytics examples and to see how teams scaled customer-facing analytics as demand grew. You can also explore self-service analytics as a product capability rather than a one-off feature.
Riskonnect, Selligent, Kenjo, Katana and Lansweeper each matched the level of control to the users they serve, instead of assuming everyone wants the same analytics canvas.
FAQ
All your questions answered.
What is self-service analytics in SaaS?
Self-service analytics lets product users explore, customize or create reports without asking the vendor to prepare every answer. It can include editable templates, dashboard builders, configurable views or conversational data exploration.
Does self-service analytics require a dashboard builder?
No. Self-service can begin with interactive filters or editable templates. A full dashboard builder provides more control, but it also requires clearer data models, permissions, onboarding and support.
How do SaaS companies keep self-service analytics secure?
They inherit user and tenant permissions from the host application, expose only approved datasets and apply guardrails to what users can view or change. Security rules should remain enforced regardless of how a report is customized.
Which users benefit most from self-service analytics?
Users with recurring questions and different reporting needs benefit most. The experience should still support less technical users through templates, defaults and guided exploration rather than assuming everyone wants a blank analytics canvas.
Written by

Ship the future of your data
Let us show you what Luzmo can do for your product.

Book your session with our analytics expert.