
Artificial Intelligence
AI Data Analysis: How It Works, Tools, and What Changed in 2026
How AI data analysis works today: grounded answers, anomaly detection, and the shift from AI that explains data to AI that acts on it.
Reading time 24 min read

Marketing
Brand and content for Luzmo’s embedded analytics platform.
How AI data analysis works today: grounded answers, anomaly detection, and the shift from AI that explains data to AI that acts on it.

80+ SaaS statistics for 2026 covering market size, growth, retention, spending, pricing, AI adoption, security and cloud infrastructure to help founders benchmark their product.

You need a new dashboard software now that Chartio is deprecating? Discover how to migrate from Chartio to Luzmo with ease.

Tableau is a solid BI tool. But how does it perform in an embedded analytics? Read more about Tableau pricing and embedded analytics use case.

What embedded business intelligence is, how it works inside software products, and how the AI layer changed the checklist. Updated for 2026.

Suffering from vendor lock-in? Here's how to take technology-agnostic approach to software development with less overhead, more innovation and lower costs.

Having bad data visualization can ruin even the best of data. Today, we show you examples of bad data visualization and how to prevent this from happening to you.
In 2026, traditional analytics are no longer enough for your product users. Take your data products to the next level with these 7 data visualization trends.
Python is one of the most popular programming languages in the world and it can be used to analyze and visualize data. Here are the best Python chart libraries for the job.
Stuck in the process of visualizing your data? Discover five ways to leverage ChatGPT for data visualization, including the best custom GPTs to use in 2024.
Writing code in React and want to present data in a way that is easy to understand? Here are the very best chart libraries for React for data visualization.
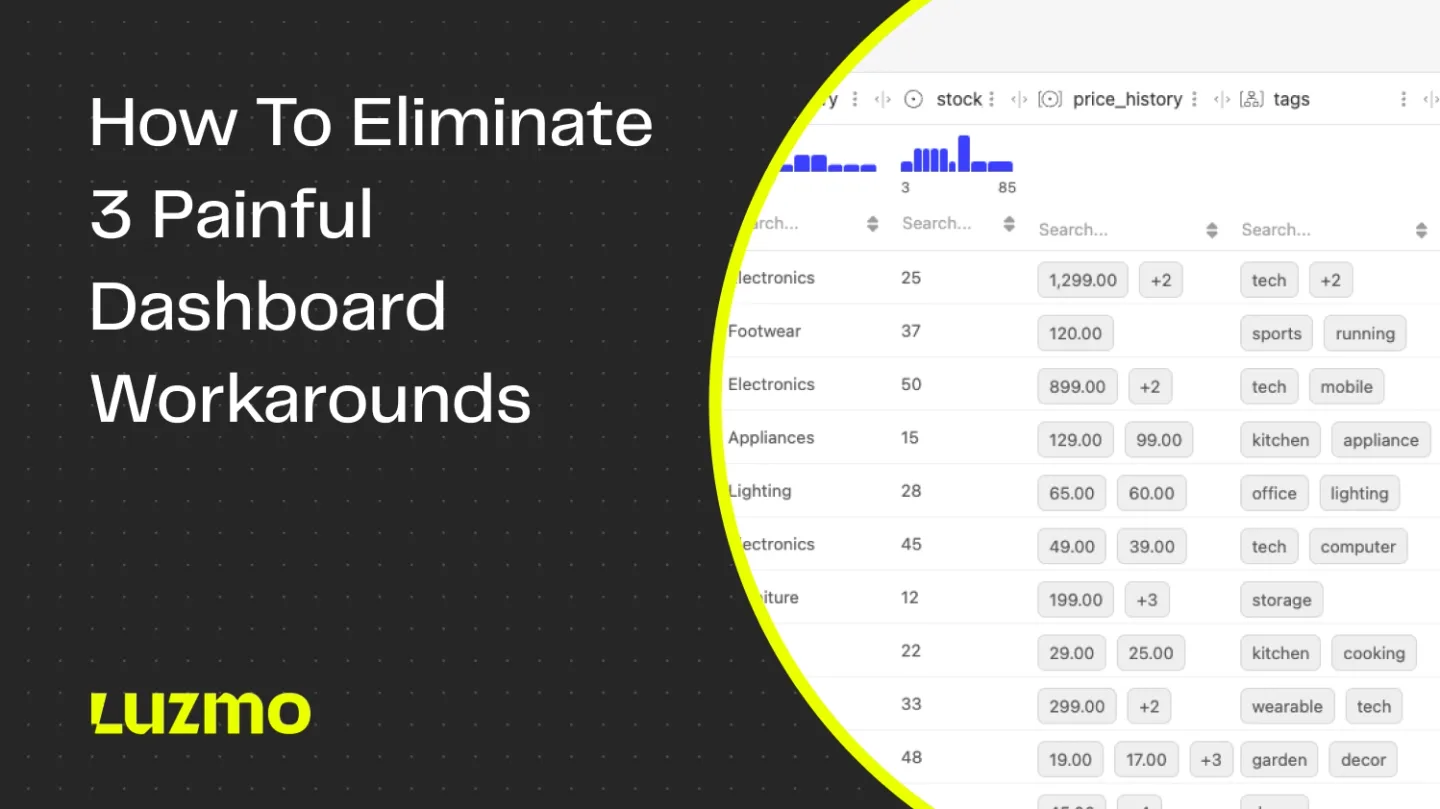
Stop wasting time on data prep. Learn how to build dashboards without data flattening, joins or complex SQL queries with Luzmo.
All the figures SaaS teams need to know about client-facing analytics, bundled. Explore key 2025 stats on dashboard adoption, struggles and trends.

Are dashboards still the best way to deliver insights? We surveyed 200+ SaaS and product leaders to find out. Explore why traditional dashboards are under pressure, and what the future holds.
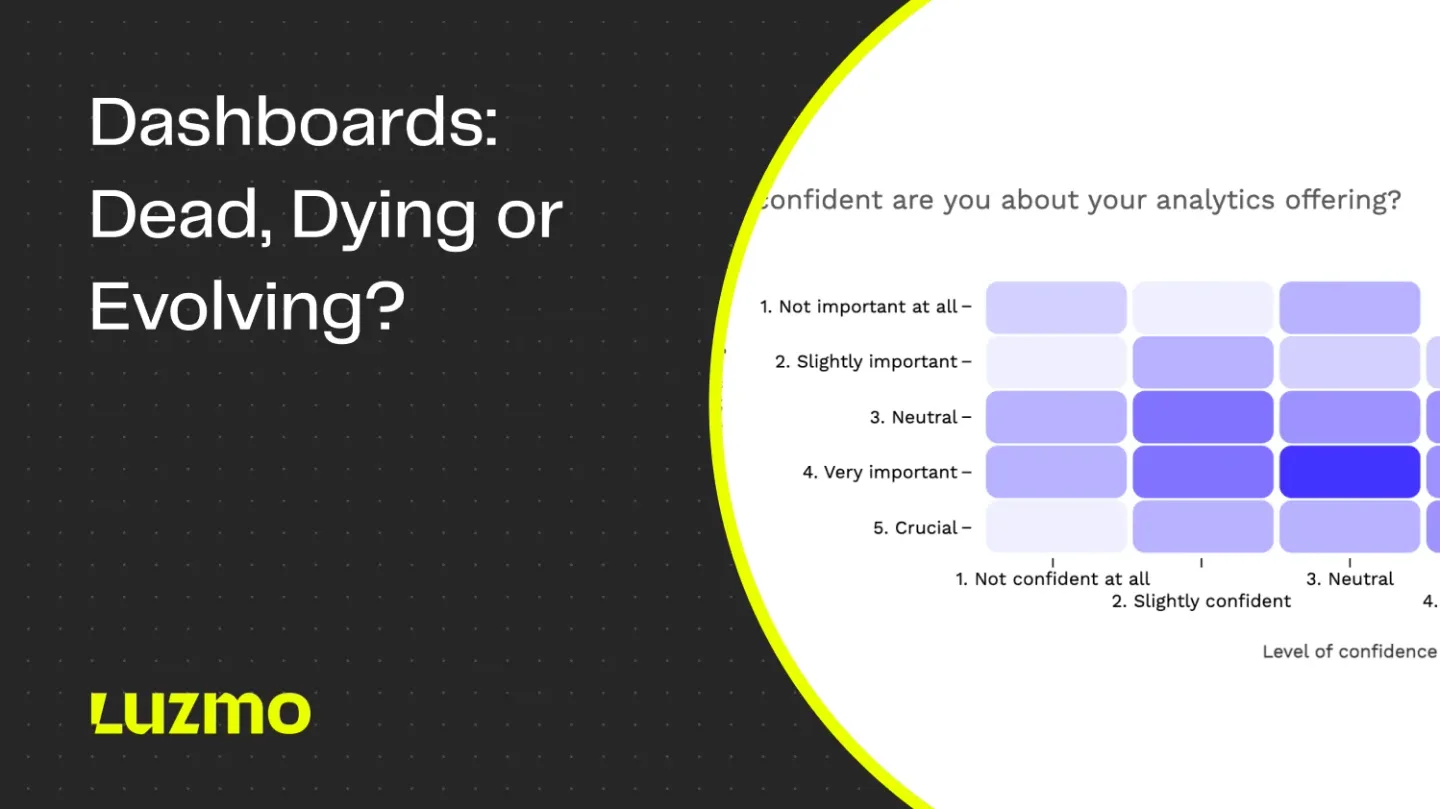
Are dashboards dead? Dying? Or just evolving? We asked 200+ SaaS leaders where present-day dashboards are falling flat, and how to fix it.
Choosing the right data warehouse is one of the cornerstones of good embedded analytics. Find out who wins in the Snowflake vs. Redshift battle.

Composable architecture is the new kid on the block in software development. Learn how your SaaS product team can use it and go to market faster.

Want to add interactive analytics dashboards to your React app? Discover the best React dashboard libraries to use in 2026.
Building user-friendly data products doesn't have to take weeks. Here are 9 advanced analytics products you could build in less than a week!
Discover Luzmo Flex, a brand-new code-first analytics SDK. Build powerful data products, tailored to your users, and break free from the conventional dashboard canvas.
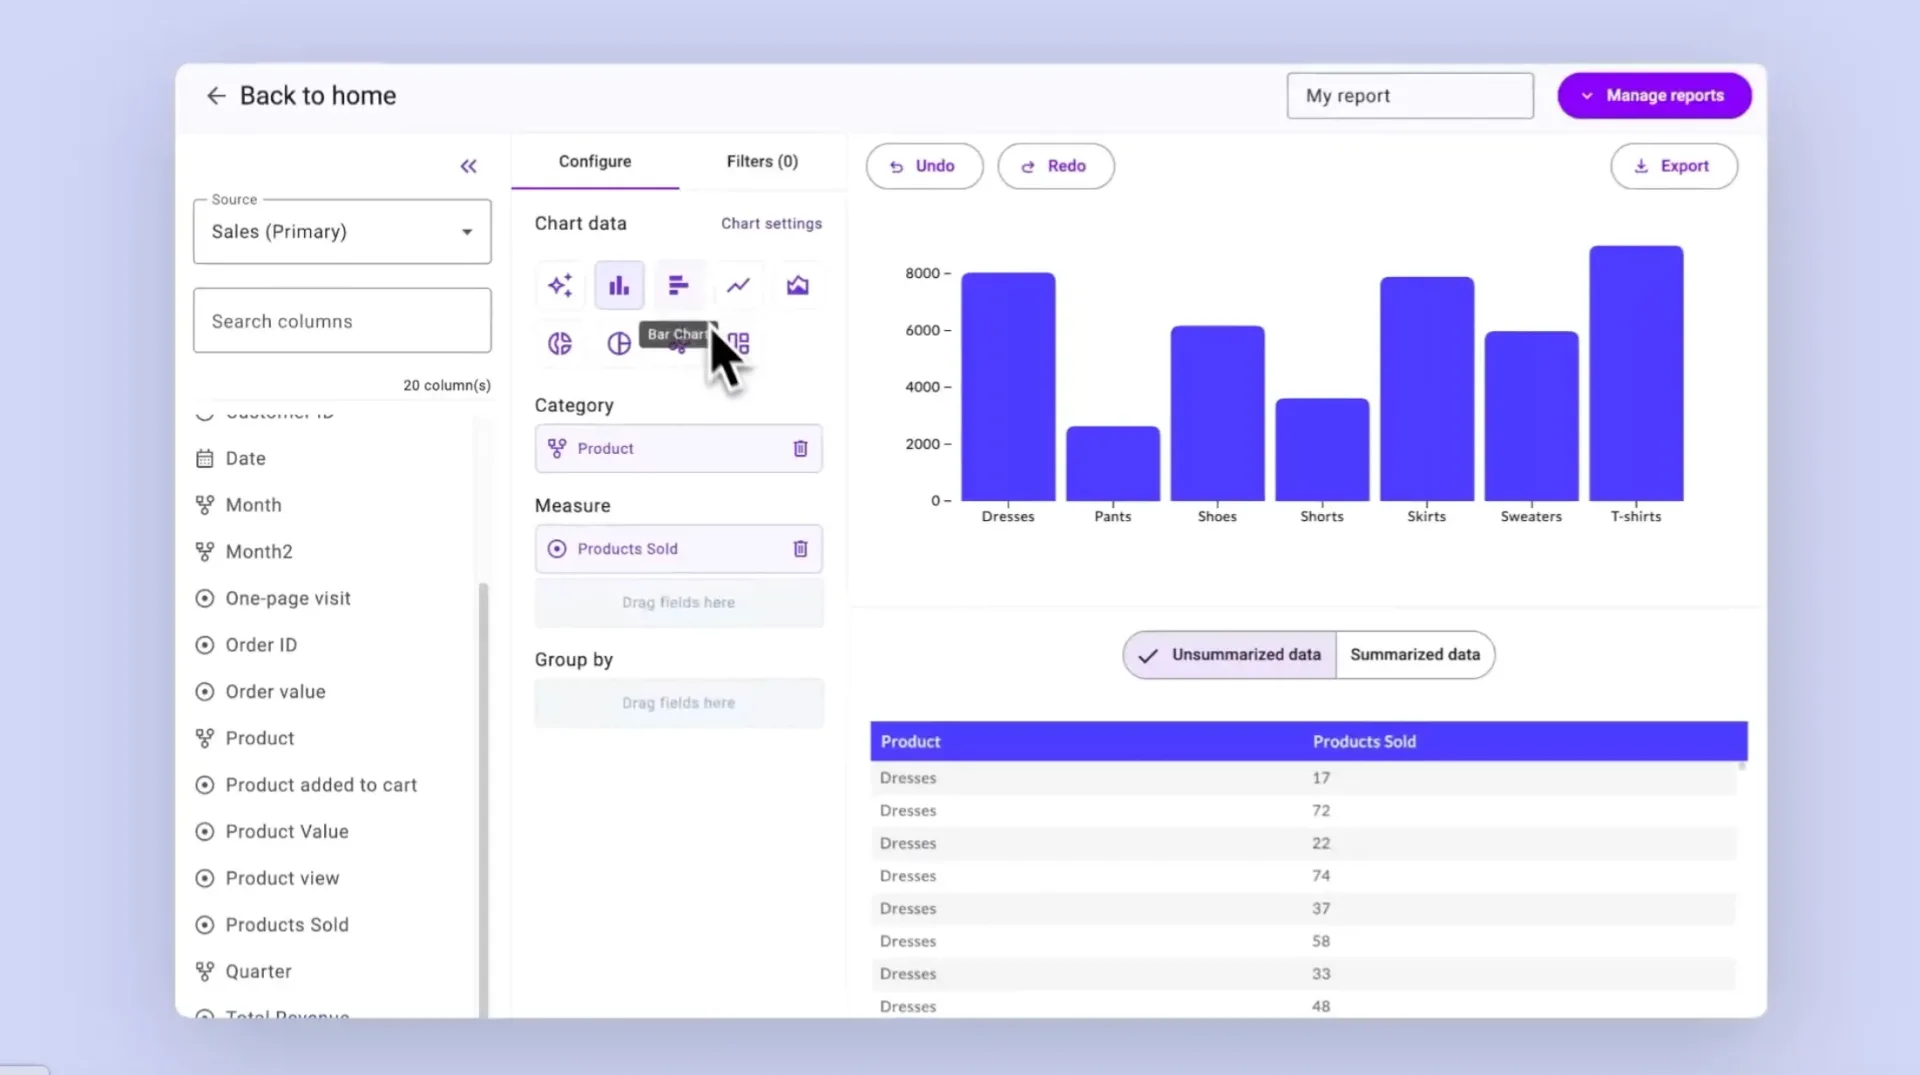
Exploring your data in Luzmo's embedded dashboard editor has become even easier. Create charts using natural language, or choose from recommended suggestions.
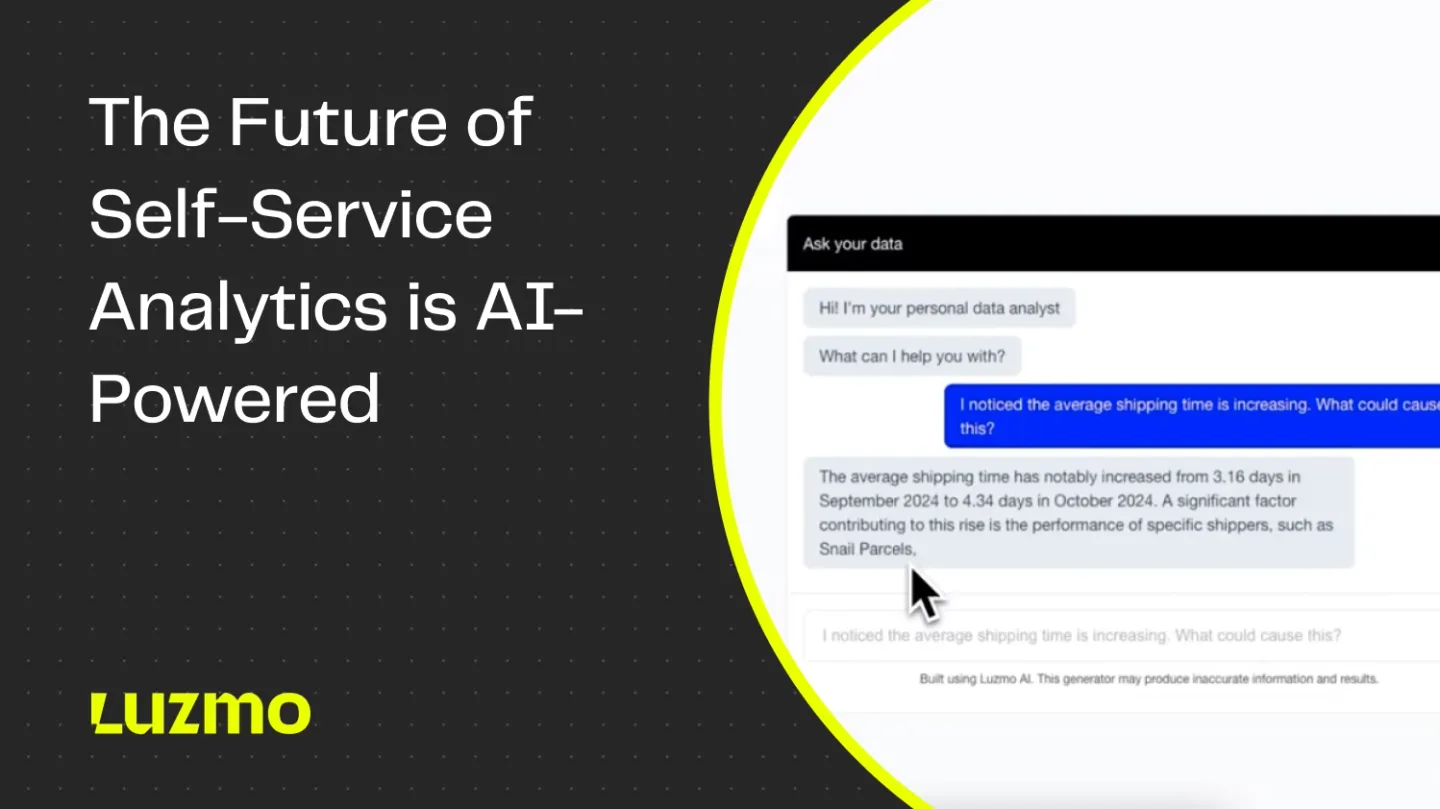
Your app users need data to make better decisions. It’s time to power your app with data: here are our predictions for the future of self-service analytics.

The culprit of a slow-loading analytics dashboard? Your underlying infrastructure. Explore the 17 best data warehouse tools to use in 2025.

Learn how to use AI for data visualization and create beautiful dashboards without getting a degree in data science.