Embedded Analytics Performance at Scale

An embedded dashboard can feel instant in a demo and struggle once hundreds of customers start using it.
The difference is rarely one slow chart. Embedded analytics performance depends on the whole path between the user and the data: the dashboard itself, the embed layer, query execution, caching, the data model and the system answering those queries.
As a SaaS product grows, another variable appears: concurrency. A query that runs quickly for one user may behave very differently when hundreds of tenants hit the same analytics stack at the same time.
That is why performance testing has to answer more than “How fast does this dashboard load?”
It also needs to answer:
What happens when the data grows, usage spikes and every customer starts using analytics at once?
What does good embedded analytics performance mean?
There is no universal dashboard load-time target.
A customer clicking a filter expects a much faster response than someone generating a complex year-end report. An interactive dashboard showing live operations also has different freshness requirements from a quarterly account summary.
Instead of choosing one arbitrary number, measure several parts of the experience:
- initial dashboard load time
- individual query latency
- interaction and filter response
- cold versus cached performance
- P95 or P99 latency under load
- concurrent user performance
- database or warehouse load
- infrastructure cost per level of usage.
Performance also needs to remain predictable.
A dashboard that normally loads in one second but occasionally takes 15 seconds during the Monday-morning traffic spike creates a different product experience from one that consistently responds in two seconds.
The same applies to cost. A technically fast analytics feature that floods your warehouse with redundant queries can become expensive as adoption grows.
Why embedded dashboards slow down as SaaS products grow
Early performance tests are unusually forgiving.
A product may launch analytics with ten customers, a modest dataset and only a handful of users opening dashboards at the same time. Queries are quick and there is little competition for database resources.
Then the product succeeds.
More tenants bring more rows. Customers use different filters. Dashboards become more interactive. Self-service generates less predictable queries. More people log in during the same business hours.
The workload changes even if the dashboard design does not.
Concurrency is particularly easy to miss. Google has previously identified database concurrency limitations as a common issue in Looker embedded deployments and recommends sizing the database or warehouse around expected query volume, not only data size.
Recent architecture guidance from Omni and Cube makes the same point: caching, query architecture and concurrent multi-tenant workloads belong in production planning from the start. Luzmo's own embedded analytics stack decision tree likewise treats data setup and scale as architecture choices, not afterthoughts.
A useful rule is simple: test the workload you expect in production, including realistic data volume, query variety and concurrency.
The five layers of embedded analytics performance
A useful way to diagnose performance is to split the system into five layers.
| Layer | Common bottleneck | First place to look |
|---|---|---|
| Dashboard UX | too much work on initial load | chart count and data shown |
| Embed layer | asset/network overhead | embed method and browser/network |
| Query layer | repeated or expensive requests | query execution and caching |
| Data model | expensive joins and aggregations | schema, indexes, materialized views |
| Data source | concurrent analytical workload | database/warehouse capacity |
A slow dashboard can involve more than one layer, so optimizing the frontend alone may have little effect when the real delay sits in the database.
Dashboard design can create unnecessary work
Every visualization needs data.
A dashboard packed with charts can generate substantially more work than an overview built around a few decision-critical metrics. Good dashboard design helps reduce both visual clutter and unnecessary work.
Luzmo's own performance guidance recommends limiting the number of charts on a dashboard and splitting overview and detail experiences when appropriate. Each chart triggers a query, with some cases requiring more than one.
This is partly a UX decision. Showing less can help users understand the dashboard faster, which is also consistent with Luzmo's broader data visualization best practices.
It is also an infrastructure decision.
If twelve charts can answer the same user question as thirty, the lighter version starts with fewer things to fetch, calculate and render.
Where the embed layer fits
Embedding method can affect loading behavior and how tightly analytics integrates with the host application.
For example, Luzmo's embedded analytics platform currently supports iframe and web-component embedding as well as SDKs for React, Vue and Angular.
A different frontend integration can improve delivery and product integration, while expensive database queries still need data-layer optimization. It helps to measure frontend/embed performance and data/query performance separately.
If the analytics surface loads immediately but individual charts keep spinning, the bottleneck probably sits deeper in the stack.
Use caching to avoid repeating work
Caching is one of the most useful performance levers in customer-facing analytics because many users repeatedly request the same or similar data.
The useful questions are what gets cached, how long it stays cached and what causes a cache miss.
In Luzmo, query caching stores query results for a configured period. When the same eligible query is requested again during that TTL, the result can be served from cache instead of querying the underlying database again. Caching can be configured at dataset level or for a database/plugin connection.
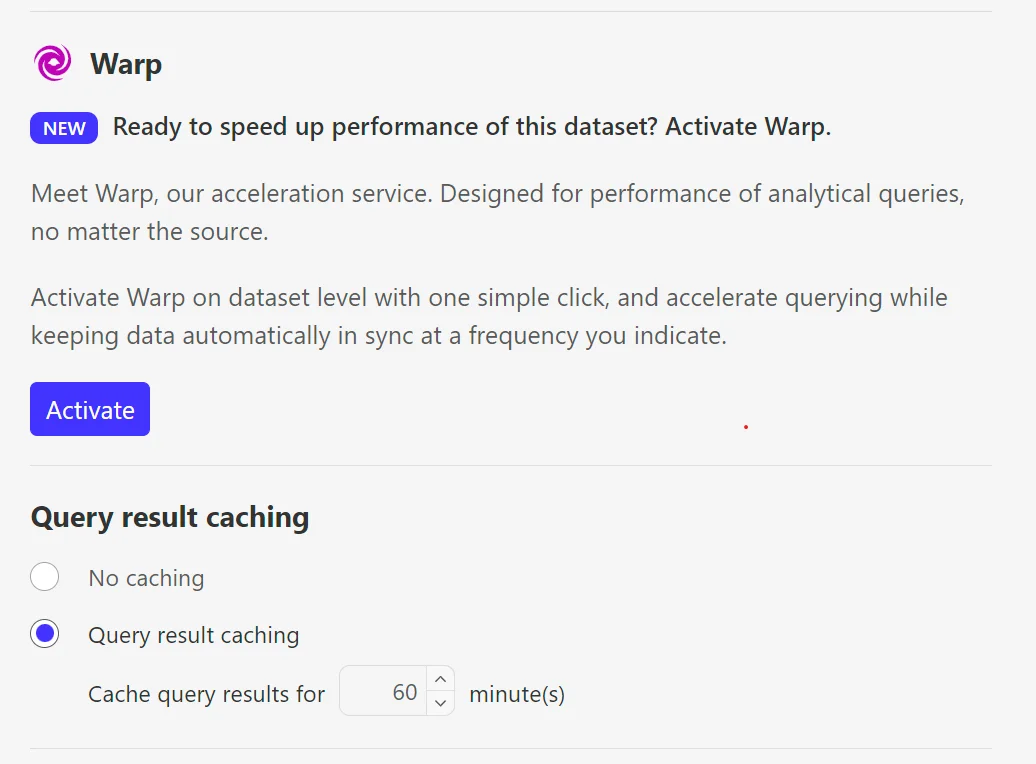
Multi-tenant caching requires additional care. Luzmo documents that cache segregation takes account of the query as well as user/embed-token context, metadata, parameter filters, token filters and connection overrides. This sits alongside the broader multi-tenancy model in Luzmo.
That distinction matters.
A fast cached result is only useful if it is also the correct result for the tenant asking for it.
When query caching works well
Caching is particularly useful when users repeatedly open the same dashboards, the same query shapes occur frequently and the product can tolerate a defined freshness window.
It can reduce latency while also reducing work on the source system.
Caching works best on top of a healthy data architecture. A highly personalized self-service query may never produce a useful cache hit. Real-time data may require a very short TTL, and an expensive query still has to execute whenever the cache is cold.
How query caching differs from analytical acceleration
This distinction is easy to miss.
A query-result cache stores the answer to a query.
An analytical acceleration layer stores or prepares data so queries can be answered efficiently in the first place.
Luzmo provides both patterns, but they work differently.
| Query caching | Luzmo Warp | |
|---|---|---|
| Stores | query results | synchronized dataset |
| Uncached query | goes to original source | queries optimized analytical store |
| Freshness controlled by | cache TTL | synchronization frequency |
| Useful for | repeated queries | sources poorly suited to analytical querying |
Warp synchronizes source data into an analytically optimized data store. Dashboard queries can then run against that store, reducing analytical load on the original operational database.
Freshness follows the synchronization schedule, plus any manual refreshes, so teams should choose a cadence that matches the use case.
For some SaaS analytics, that is completely acceptable. For others, live queries are a requirement.
Performance architecture always involves balancing speed, source load and freshness.
Your operational database may be the bottleneck
A transactional database and an analytical workload solve different problems.
PostgreSQL, for example, can absolutely power customer-facing analytics. At moderate data volumes and with good query design, querying it directly may be the simplest option.
Problems appear when analytical scans, aggregations and concurrent dashboard requests begin competing with the application's transactional workload. This is a common point where teams revisit the wider customer-facing analytics architecture and decide whether direct queries still fit.
That is when teams may need to add indexes, materialized views, a read replica, an analytical warehouse or an acceleration layer.
Luzmo has published a dashboard performance benchmark using 11.11 million PostgreSQL rows, comparing the standard source with the same data accelerated through Warp. In the larger-data tests, the optimized setup stayed around the one-second mark and reached an improvement of up to 25× in the tested scenarios.
That 25× figure is a benchmark result, not a universal performance promise. Actual results depend on the source, query patterns, schema, chart complexity and workload. The useful takeaway is that data-source architecture can have a major effect on dashboard speed.
Fix the data model before buying more compute
Teams often respond to slow analytics by increasing database or warehouse capacity.
Sometimes that is necessary. Often the queries are doing unnecessary work.
Common improvements include:
- adding appropriate indexes
- materializing expensive aggregations
- creating query-friendly schemas
- avoiding unnecessary fine-grained joins
- using read replicas
- denormalizing analytical data where it makes sense
- moving large analytical workloads to a specialized analytical database.
These are also part of Luzmo's documented performance recommendations.
The best optimization depends on the workload. A dashboard that repeatedly calculates the same daily metric across years of granular data may benefit from a materialized aggregate. A filter query on tenant ID may benefit from appropriate indexing. A large analytical workload running against the application's production database may justify a separate analytical store.
Aim to do less unnecessary work per user interaction. The right design can be simple or sophisticated depending on the workload; Luzmo's embedded analytics readiness guide is a useful companion when deciding how much infrastructure a use case actually needs.
Data volume and concurrency are different problems
Data volume is only one part of performance. A large dataset can perform well with the right query path, while a smaller dataset can still struggle under heavy concurrency or inefficient queries.
Imagine two systems:
System A: 50 million rows and five users.
System B: 5 million rows and 1,000 users opening dashboards simultaneously.
System B may create the harder infrastructure problem.
Customer-facing analytics is often bursty. Many users log in during similar business hours, open the same product pages and trigger multiple queries at once.
That creates pressure on query queues, database connections and warehouse compute even when individual queries are efficient.
Current architecture guidance from Cube explicitly warns that multi-tenant embedded workloads should be designed around concurrent queries as well as single-query latency. This is one of the reasons embedded analytics tools should be evaluated under realistic production traffic rather than only in a demo.
This is also where the noisy-neighbor problem appears: one large or unusually active tenant can consume shared resources and affect the experience of others.
That deserves its own architecture discussion. For performance testing, simulate many realistic users at the same time and vary the queries they send.
Performance and cost are connected
The performance problem eventually becomes a financial problem.
With live-query architectures, more uncached requests mean more database or warehouse work. The exact cost depends on the infrastructure and billing model, but redundant queries rarely help either latency or economics.
With extracted or synchronized data, some of that burden moves elsewhere: storage, synchronization and operating another analytical layer.
There is no architecture where scale is free.
That is why the most useful cost question is not:
How much does the analytics platform cost?
It is:
How much total work does our analytics stack perform for each level of customer adoption?
Our embedded analytics pricing comparison covers vendor billing models separately. From a performance perspective, reducing redundant work usually helps both latency and infrastructure cost.
How to diagnose a slow embedded dashboard
Start with the symptom rather than guessing at the cause.
| Symptom | Investigate first |
|---|---|
| Cold load slow, repeat load fast | caching/source query |
| Every chart slow | data source or model |
| One chart slow | that query and visualization |
| Filters slow | filtering/query design/indexing |
| Fast during testing, slow at peak time | concurrency |
| Only large tenants slow | tenant data/query pattern |
| Remote regions consistently slower | network/embed delivery |
| Infrastructure bill grows faster than usage | redundant or expensive queries |
These are starting points, not diagnoses.
Performance tooling should help you separate query execution from other parts of the request. Luzmo's data API can return a performance object with query responses, while the chart-level performance indicator breaks down retrieval, validation, preparation, queueing, querying, processing and rendering time.
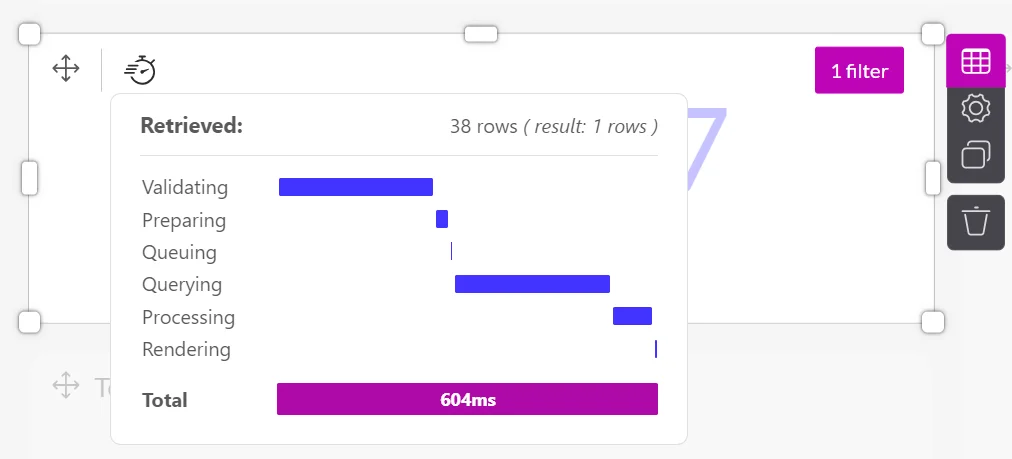
Measure before optimizing.
Otherwise, teams often spend days changing frontend behavior when the problem is a database query, or tune the database while most user requests are already spending their time somewhere else.
How to performance-test embedded analytics before production
A useful test should resemble production as closely as possible.
Test at least:
Cold dashboard loads. Measure the first request when the relevant result is not cached.
Warm dashboard loads. Measure repeat use separately so you know what caching actually changes.
Your largest realistic tenant. Average customers can hide the problem that appears with your largest dataset.
Real filters and drilldowns. Do not test only the default dashboard state.
Concurrent users. Simulate the traffic pattern you expect, including peaks.
Query variety. Sending the exact same request hundreds of times can create an unrealistically high cache-hit rate.
Source-system health. Watch what dashboard traffic does to the database or warehouse behind it.
Tenant isolation. Performance optimization must not change which data each user is allowed to access.
Cost. Measure the queries, compute or infrastructure consumed during the test.
For customer-facing analytics, P95 latency under realistic concurrent load can tell you more than the fastest query in a benchmark. MotherDuck makes a similar point in its 2026 analysis of embedded analytical workloads: bursty traffic, concurrent users and predictable tail latency can be more informative than raw benchmark throughput. Testing these conditions early also helps avoid the kinds of production gaps described in why embedded analytics often misses the mark.
How Luzmo approaches embedded analytics performance
Luzmo gives product teams several ways to match analytics architecture to their data setup. Teams comparing that choice with an in-house build can also use the build vs buy customer-facing analytics guide to frame the infrastructure tradeoffs.
Live queries
Luzmo supports live queries against connected data sources for teams that need data to reflect the current source.
Query-result caching
Teams can configure caching so repeated eligible queries can be served from memory for a defined TTL rather than hitting the underlying source every time.
The cache also accounts for user and tenant-related query context, which is particularly important for embedded multi-tenant analytics.
Warp
For an operational data source that struggles with analytical workload, Warp can synchronize the dataset into an optimized analytical store and serve dashboard queries there instead.
Luzmo's own benchmark showed up to a 25× improvement for its tested 11.11-million-row PostgreSQL scenario, but teams should benchmark their own data and query patterns rather than treating that number as a universal guarantee.
Performance visibility
Luzmo also exposes query performance information, giving teams a way to investigate slow requests instead of treating dashboard latency as a black box.
The right combination depends on the application.
A SaaS product using an analytics-ready warehouse may be perfectly happy with live queries plus caching. A product querying a transactional source may benefit more from data optimization or Warp. A highly dynamic use case may prioritize freshness and accept more source queries.
The important part is making that decision deliberately.
13 questions to ask an embedded analytics vendor about performance
Before choosing a platform, ask:
- What exactly do you cache?
- What causes a cache miss?
- Can we configure cache TTL?
- Can we invalidate cached data programmatically?
- How is cached data segregated between tenants?
- Do you query our data source live or copy the data elsewhere?
- If data is copied, how does synchronization work?
- How can we inspect slow queries?
- What happens when many tenants query at once?
- How should we test your platform under load?
- What changes when one tenant becomes much larger than the others?
- How does performance optimization affect data freshness?
- How will infrastructure cost change if analytics usage grows 10×?
Use a vendor demo as the starting point for a performance evaluation, then validate the platform with your own data, tenant model and realistic load.
The bottom line
Embedded analytics performance is a system-level problem.
Dashboard design determines how much work starts at once. The embed layer affects delivery. Caching determines how often work needs to be repeated. The data model determines how expensive queries are. The database or warehouse determines how well those queries hold up under concurrent load.
The architecture that works for ten customers may need to evolve before you serve a thousand. Test the current workload and the scale you expect next.
Measure cold and warm loads. Test your largest tenants. Add concurrency. Watch the source system. Measure cost alongside latency.
And when a dashboard slows down, find the layer causing the delay before adding another workaround.
Written by

Ship the future of your data
Let us show you what Luzmo can do for your product.

Book your session with our analytics expert.