Best Embedded Business Intelligence Software in 2026
If you're building a SaaS product, you've probably hit the moment where your customers start asking: "Can I see my data inside your platform?" That's exactly the problem embedded business intelligence software solves – and the market for it is growing fast.
Embedded BI lets you integrate interactive dashboards, charts, and analytics directly into your application, so your users never have to leave to get insights. The challenge? Most tools on the market weren't designed with this use case in mind. They were built for internal data teams first, and embedding was bolted on later – and it shows. Picking the wrong one can cost you months of developer time, a frustrating customer experience, and a price tag that spirals as you scale.
This guide cuts through the noise and ranks the best embedded BI tools available right now – starting with the one that's genuinely built for the job, and being honest about the limitations of everything else.
1. Luzmo: Best purpose-built embedded BI for software
If you're a software company that wants to deliver analytics to your end users without rebuilding your entire product from scratch, Luzmo is the clear choice… and it's not particularly close.
Luzmo is a dedicated embedded analytics platform designed specifically for SaaS companies that want to deliver interactive, white-labeled dashboards to their end users. The key word is dedicated. Every other tool on this list was designed for something else first. Luzmo was built from the ground up for client-facing analytics inside customer products; and that foundational difference shows up everywhere, from the SDK architecture to the pricing model.
Native embedding, not iframes
Most "embedded" BI tools are just iframes with a lick of paint. Luzmo takes a fundamentally different approach. Dashboards are embedded via a lightweight web component or SDK, which means they load as part of your app – not as a foreign object inside it. The visual result is a dashboard that looks and behaves like it was built by your own team.
True self-service, not simulated self-service
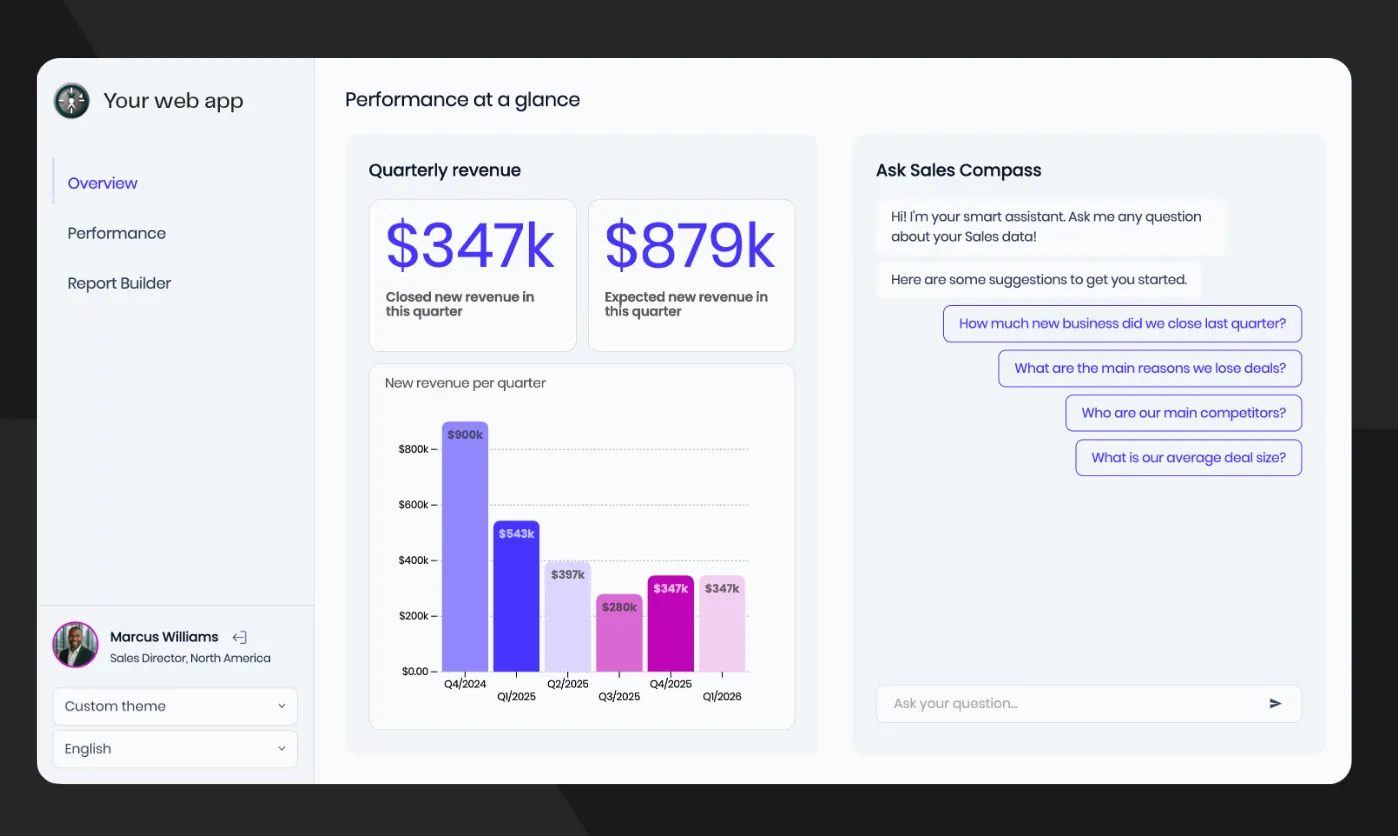
A lot of tools claim self-service but really mean "users can filter a pre-built dashboard." Luzmo's self-service analytics goes further: end users can filter, explore, build their own dashboards, and get AI-powered answers to questions in plain English – all from inside your product. That matters because it shifts the analytics burden away from your engineering and support teams. Instead of your developers fielding endless requests for new reports, your customers just help themselves.
Multi-tenancy that actually works
For SaaS companies serving multiple clients, multi-tenancy isn't a nice-to-have – it's a hard requirement. Every customer needs to see only their own data, and the architecture needs to enforce that reliably at scale. Multi-tenancy is one of Luzmo's core architectural strengths, not an add-on. Row-level security, tenant isolation, and data partitioning are built in. For regulated industries or applications handling sensitive customer data, this matters even more.
White-labeling that goes all the way
Some tools let you change the logo. Luzmo lets you control everything: colors, fonts, border styles, loading spinners, email alert branding. The result is a dashboard your customers genuinely believe was built in-house. This isn't just cosmetic – it directly affects user adoption, brand trust, and your ability to charge for analytics as a premium feature.
Luzmo Flex for developer-grade customization
When drag-and-drop isn't enough, Luzmo Flex is a code-first analytics SDK that gives developers full control over every aspect of the data experience. Companies like Element Logic used it to move from standard dashboard layouts to a fully custom data-product environment in a matter of weeks.
Luzmo IQ for AI-powered analytics
Luzmo IQ brings natural language querying, AI-generated summaries, and agent APIs directly into your embedded product.
Users can ask questions in plain English – "Show me last month's top-performing regions" – and get instant visual answers. You can even give your own product chatbot the ability to generate data visualizations on the fly.
The real cost argument
Here's something most product teams underestimate: building analytics in-house typically costs $350,000–$500,000+ in year one alone, once you factor in the engineering talent required to design, build, test, and maintain a production-grade analytics layer. Luzmo's pricing starts at $490/month – that's less than $6,000 per year. Even at the Enterprise tier, you're spending a fraction of what internal development would cost, while shipping faster and maintaining zero internal maintenance burden.
And analytics isn't just a cost centre. Companies with embedded analytics consistently report enterprise close rates increasing 25–30%, support ticket volumes dropping significantly, and new recurring revenue unlocked through premium analytics tiers. Fleet Perfection, a logistics SaaS platform, used Luzmo's real-time dashboards to speed up vehicle sales by 30%. Spaceflow, a PropTech platform, reduced custom reporting requests by 80% after embedding Luzmo dashboards.
Pricing: Luzmo's plans start at $490/month (Basic), and offers $1,995/month (Premium), billed annually. Enterprise pricing is available. There's no per-viewer seat pricing as you scale, which keeps costs predictable – a major advantage over alternatives that charge per user.
Who it's best for: Any software company that wants to launch customer-facing embedded analytics applications quickly, without a team of dedicated BI engineers or months of custom development.
2. Tableau Embedded Analytics: strong visualizations, weak at embedding
Tableau has a strong reputation in internal data visualization. Its chart library is wide, the drag-and-drop interface is polished, and the community is large. If you're building internal dashboards for your own data team, it earns its reputation.
But that reputation doesn't translate cleanly to embedded use cases. Tableau was designed for analysts sitting inside a company's internal tools – not for customer-facing analytics inside a SaaS product. The embedding experience reflects that: dashboards often look like a third-party tool dropped into your product, the branding control is limited, and customizing the look and feel to truly match your app requires workarounds.
Pricing is another problem. Tableau's licensing model gets expensive quickly when you start multiplying across your customer base, and the per-viewer costs can become a meaningful barrier to scaling customer-facing analytics. For most SaaS companies, those costs and limitations make Tableau a poor fit unless you're already deeply committed to the Salesforce ecosystem.
Who it's realistically best for: Internal analytics teams inside companies with existing Salesforce infrastructure. Not a natural fit for SaaS products with customer-facing requirements.
3. Microsoft Power BI Embedded: solid internally, clunky to embed
Power BI is a capable platform when you're fully inside the Microsoft stack. Azure integration is seamless, the feature set has matured, and row-level security is solid for internal reporting use cases.
The friction appears as soon as you try to embed it in a customer-facing product. Styling control is limited, dashboards frequently look out of place inside non-Microsoft applications, and the embedding experience – often iframe-based – rarely achieves the native feel that SaaS customers expect. Report creation is locked to Power BI Desktop, so true self-service for your end users is off the table. As one embedded analytics tools comparison notes, Power BI's embedding often "feels clunky" with modules that "look like a foreign object in your app."
The usage-based pricing structure for Power BI Embedded also makes cost forecasting unreliable as your user base grows – a real problem when analytics is a product feature you're trying to scale predictably.
Who it's realistically best for: Enterprises already committed to Microsoft Azure infrastructure that need embedded analytics as a secondary feature, not a primary product differentiator.
4. Looker: powerful governance, prohibitive pricing
Looker's LookML semantic layer is genuinely impressive for large organizations that need a single, authoritative definition of every metric across their data model. If data governance at enterprise scale is your primary concern, Looker's approach is architecturally strong.
Everything else, however, is a challenge. Looker's pricing has become notoriously steep – starting at $60,000/year, with dashboard viewers charged an additional $400 per user annually. For SaaS companies embedding analytics for hundreds or thousands of end users, those viewer costs alone can make the economics completely unworkable. The LookML learning curve is steep, visualizations are functional but limited in customization, and the embedding experience relies heavily on iframes rather than native SDK integration. For most custom dashboard software use cases, those limitations may outweigh the governance benefits.
Who it's realistically best for: Large enterprises with dedicated data engineering teams, deep Google Cloud investment, and a primary need for internal metrics governance rather than customer-facing analytics.
5. Sisense: deep customization, high complexity cost
Sisense is a capable embedded analytics platform with strong SDK support, and it's been around long enough to have a solid enterprise reputation. If you have a team of dedicated BI developers who want fine-grained programmatic control over the analytics experience, it can deliver.
The practical challenges are real, though. Reviewers consistently flag that complex dashboards require substantial JavaScript investment. Sisense pricing is opaque – there's no public pricing page, quotes require a lengthy sales process, and various sources suggest a floor around $25,000/year before you've customized anything. Performance can degrade with large datasets if you haven't done careful optimization upfront. And smaller teams frequently report the product being overwhelming for straightforward needs. For SaaS companies that want to ship analytics features quickly without dedicated BI engineers, the complexity cost is often prohibitive.
Who it's realistically best for: Larger organizations with in-house BI developers, significant budget, and time to invest in implementation.
6. Amazon QuickSight: best if AWS is your entire universe
QuickSight integrates naturally with AWS services, uses a pay-per-session pricing model that works for infrequent analytics usage, and scales reliably with AWS infrastructure. Machine learning features like anomaly detection and forecasting are built in.
Outside the AWS ecosystem, the appeal diminishes sharply. The interface is less intuitive than purpose-built embedded tools, visual customization is limited, and embedding often produces dashboards that feel functional rather than polished. For SaaS products where the analytics experience is a meaningful part of the customer value proposition, QuickSight rarely delivers the seamless, branded experience that drives adoption.
Who it's realistically best for: Teams with a pure AWS stack and modest requirements for the look and feel of their embedded analytics.
7. GoodData: enterprise multi-tenancy, opaque pricing
GoodData has legitimate enterprise credibility, particularly for complex multi-tenant deployments. Its semantic layer is strong, and it supports React and Python SDKs for building custom analytics components.
The challenge for most companies evaluating it in 2026 is transparency. GoodData's pricing has shifted to an enterprise-only model where most premium capabilities are still determined on a sales call. For product teams trying to budget analytics as a line item on a defined roadmap, this kind of opacity is a real friction point. Time-to-market is also a concern – the implementation process is longer than purpose-built alternatives, and smaller teams often find the learning curve steep relative to the value delivered.
Who it's realistically best for: Large enterprises with complex data governance requirements, dedicated implementation resources, and a preference for API-first architecture.
How to choose the right embedded BI tool
With that landscape in view, here are the questions that actually matter when you're making this decision:
- Was embedding designed in, or bolted on? This is the most important question, and the one most vendor marketing glosses over. Most of the tools above – Tableau, Power BI, Looker – were built for internal analytics and later adapted for embedding. The difference is visible in the output: dashboards that look foreign inside your product, limited branding control, and iframe-based integration that creates load and UX problems. If customer-facing analytics is your goal, you want a platform designed for that from day one.
- Can you actually ship with it? It's worth building a dashboard mockup early to validate how quickly your team can move from concept to production. Some platforms require weeks of setup and specialized LookML or JavaScript knowledge before a single dashboard is live. With Luzmo, customers like Intent Technologies have gone from concept to live dashboards in hours, not weeks.
- What does the pricing look like at your target scale? Run the numbers at 100 customers, then 1,000. Per-viewer pricing models that seem reasonable at small scale become painful quickly. Luzmo's approach – predictable monthly tiers without per-viewer seat fees – is designed specifically so that the pricing scales alongside your product growth, not against it.
- Is your analytics a cost or a revenue line? The most forward-thinking SaaS companies treat embedded analytics as a revenue multiplier, not a cost centre. When you can offer white-labeled dashboards, self-service reporting, and AI-powered insights as part of a premium tier, analytics directly drives ARR. That shift requires an underlying platform built for that purpose – not an internal BI tool stretched to fit a customer-facing context.
- Is the data architecture sound? Whether you're connecting cloud data warehouses, SQL databases, or APIs, understanding cloud analytics platforms and data discovery patterns matters before you buy. The best embedded BI tools connect to your existing data stack without requiring you to rebuild your infrastructure around them.
Final thoughts
The embedded BI market has more options than ever, but most of them were designed for a different problem. Tableau, Power BI, and Looker are powerful internal analytics tools. QuickSight is a good fit if AWS is everything. Sisense and GoodData serve large enterprises with significant engineering resources. They all have legitimate use cases – just not primarily the one most growing software companies actually have.
For software companies that want to build the best analytics dashboards for their customers – quickly, with a native feel, at predictable cost, and without a team of dedicated BI engineers – Luzmo is in a different category. The combination of purpose-built embedding, genuine self-service, transparent pricing, integrated analytics tooling, and real-world customer outcomes puts it ahead of everything else on this list for the most common use case.
The rest of the tools exist and have their niches. But if the question is "what's the best embedded BI for a SaaS company that wants to ship analytics as a product feature," the answer is Luzmo… and the gap is huge.
Ready to see what embedded analytics looks like when it's built for your use case? Explore Luzmo's pricing or book a free demo to see it running inside a product like yours.
Written by

Ship the future of your data
Let us show you what Luzmo can do for your product.

Leave your e-mail and one of our analytics experts will reach out to you