
Saas Growth Trends
7 Most Important SaaS Trends in 2026
What does the future hold for the software as a service industry? Find out the most important SaaS trends for 2026.
Reading time 12 min read

Content
Technical content on dashboards, APIs, and embedding analytics in products.
What does the future hold for the software as a service industry? Find out the most important SaaS trends for 2026.
Data analytics can empower your business with better decision-making, more efficiency and revenue. Here are the best BI tools to help you get there.
The chart you use can make a difference between an amazing dashboard and one that no one understands. Here are the top chart types for data visualization.

A practical guide to dashboard reporting: composable components, delivery by email and chat, and reporting dashboard examples for client-facing teams.
Data intelligence explained: how analytics, data management, and AI combine into one decision loop, with a concrete example. Updated for 2026.

What multi-tenancy means, how row-level security enforces tenant isolation, and why the same rules must apply when AI agents query your data.
What Power BI Embedded does well, how capacity-based licensing really behaves at product scale, and where purpose-built embedded platforms differ.
What Domo is, what it does well, how much it costs, and how it handles embedded, customer-facing analytics. Updated for 2026.
A current overview of ThoughtSpot: its AI-powered product line, pricing structure, what it does best, and where embedded analytics needs differ. Updated for 2026.
White label reports, white label reporting systems, and white label analytics: what to look for, theming depth, and how the AI layer gets branded too.
Want to get more insights from your data? Here are the very best data visualization tools available on the market in 2026.
There are many embedded analytics tools out there, with different features and pricing. Here is how to choose an embedded analytics tool suited for your needs.
Looker is a powerful business intelligence tool. But how does it perform in an embedded environment? Let’s find out in this detailed review.
Qlik is a popular BI tool for businesses of all sizes. Qlik embedded analytics allows companies to embed dashboards in websites or apps. Here is how it works.
Want to empower your end-users to make more data-driven decisions? Here are some of the top self-service analytics tools to consider.
Self-service BI puts power in the hands of your customers and end-users. Here is what it is, how it works, and how your business can benefit from it.
ThoughtSpot Sage is this company’s AI offering, allowing anyone without a data science background to explore data. Here is what it is and how it works.
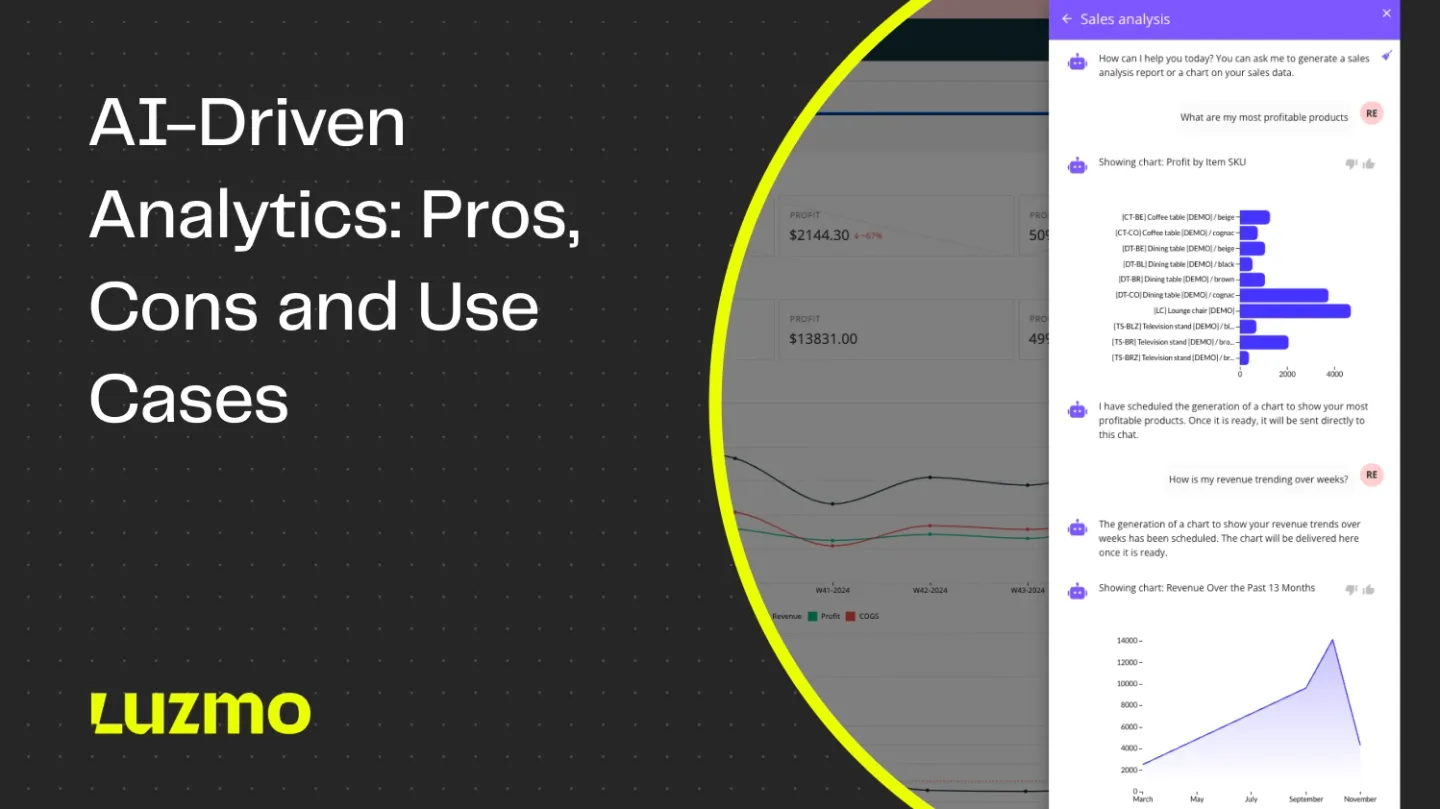
AI-driven analytics can save time and help make better decisions in any business. But is it all that simple?
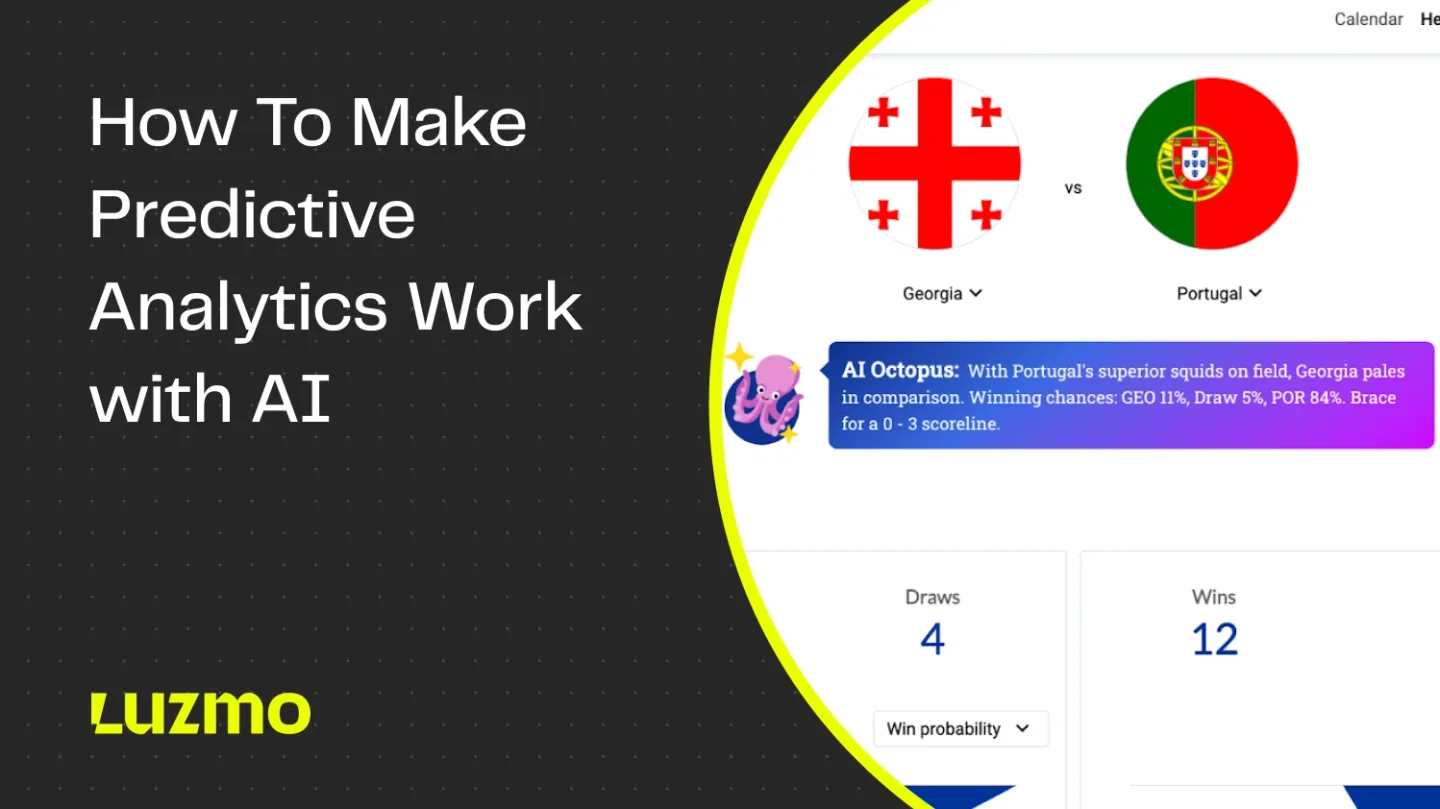
AI predictive analytics helps make forecasts about the future based on past data. Here is everything you need to know about it.
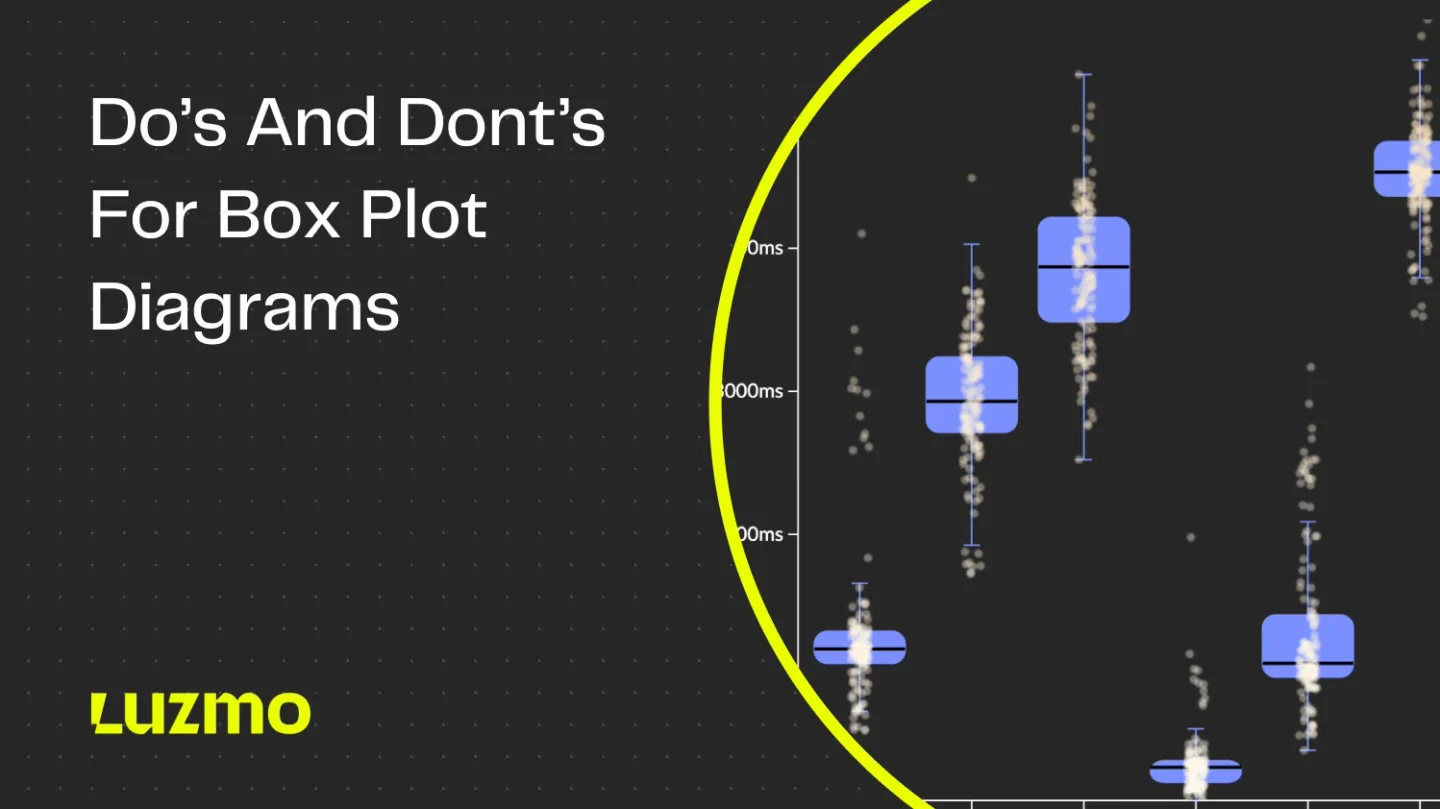
Box plot diagrams can show your target audience a world of information if used correctly. Here is how to do just that.
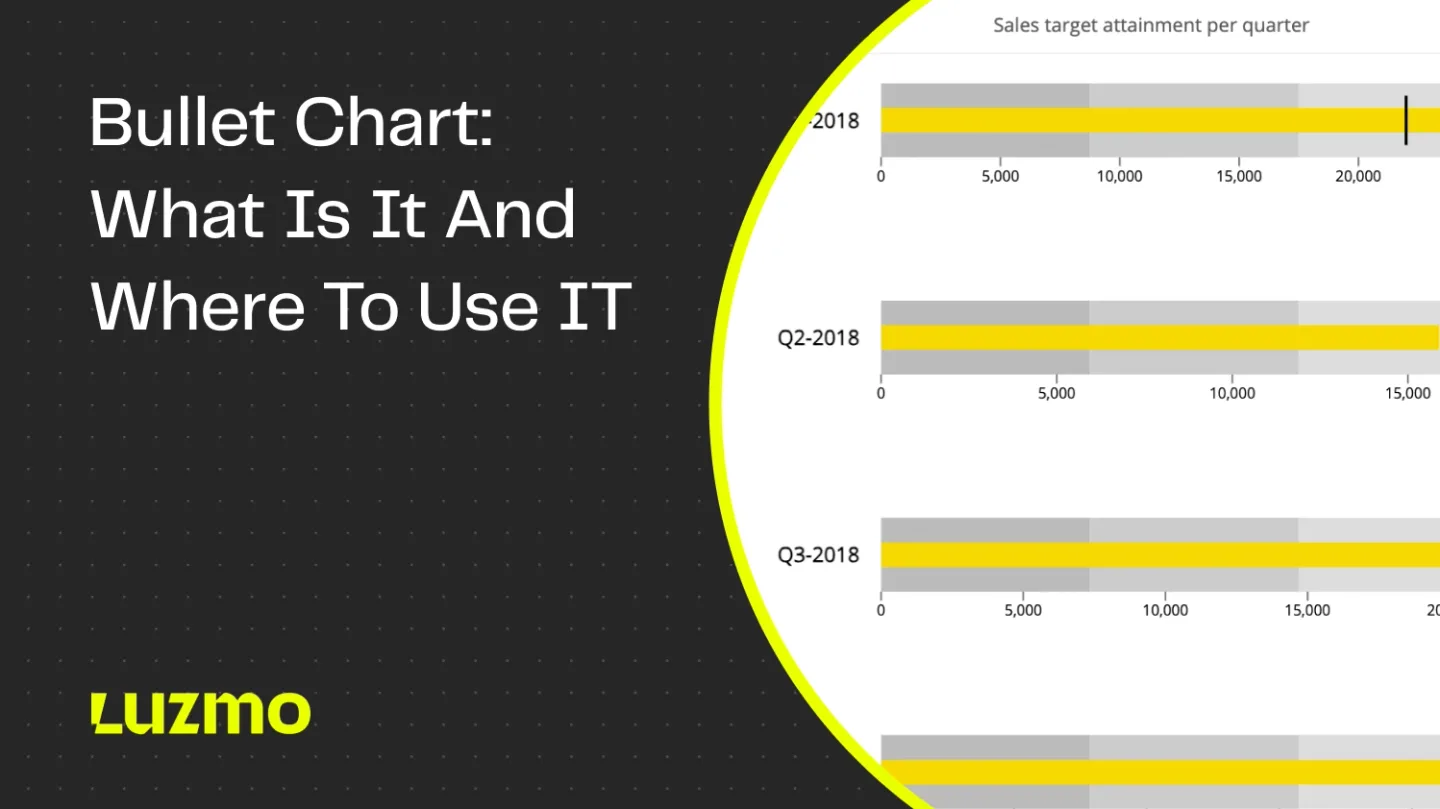
Bullet charts are a popular type of visualization used in dashboards and reports. Here is what you should use them for.
Data science pipelines automate how data is transformed from raw numbers into actionable insights. Here’s everything you need to know about them.
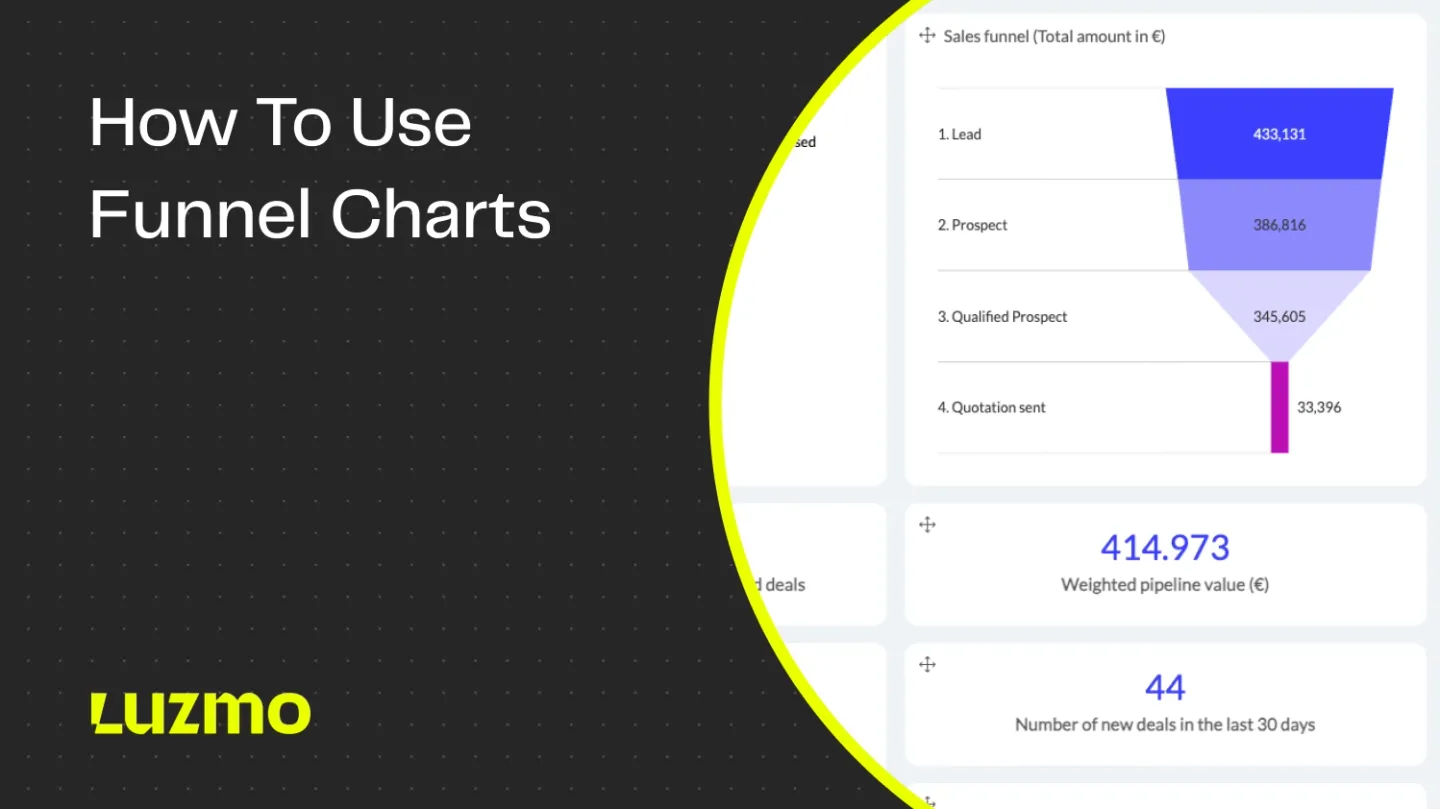
Funnel charts are an effective visualization tool. But if you don’t use them the right way, they can do more harm than good. Here is a definitive guide on funnel charts.
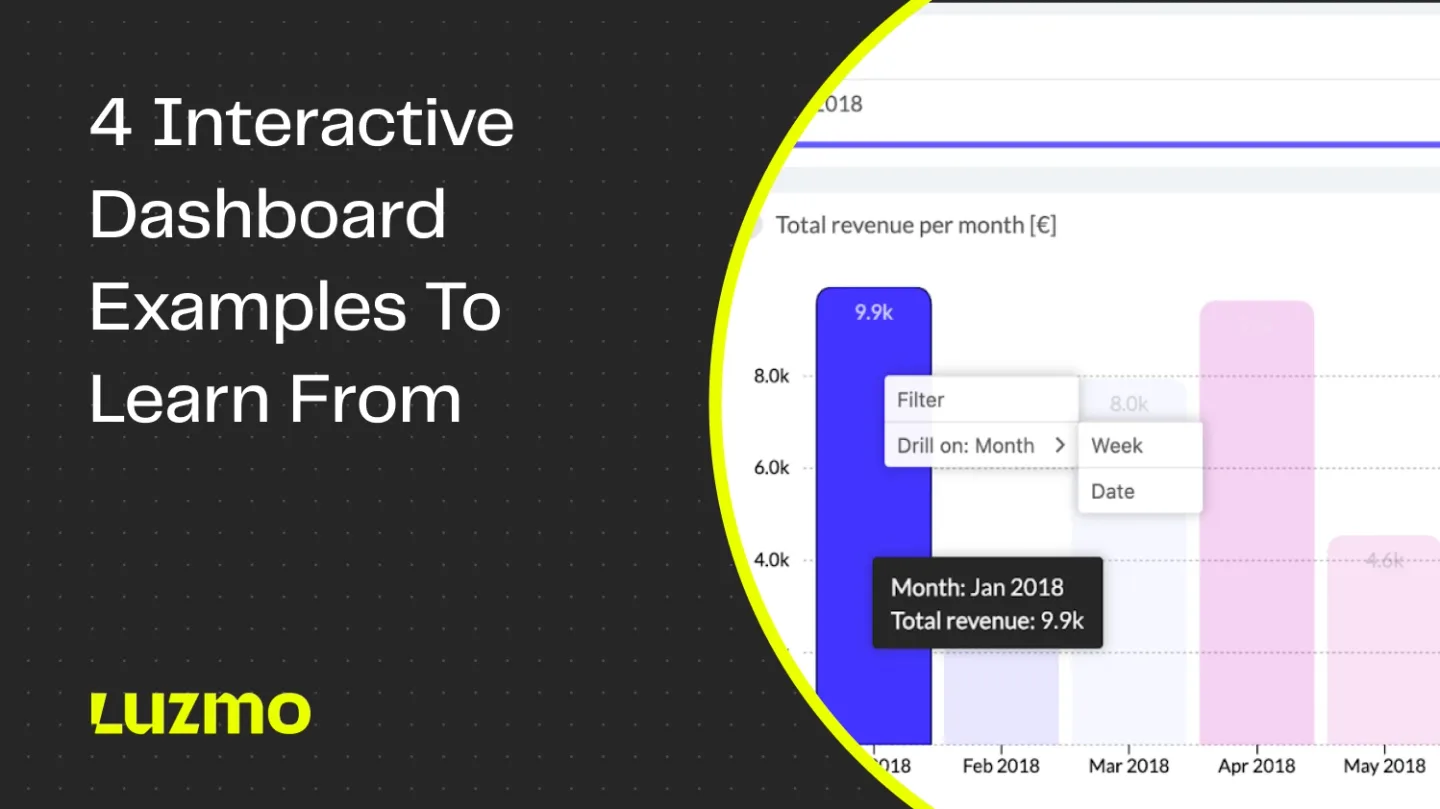
An interactive dashboard shows you the most important information you need in real time. Here is what this dashboard is and how it works.